Unlock a world of possibilities! Login now and discover the exclusive benefits awaiting you.
- Qlik Community
- :
- Forums
- :
- Analytics
- :
- New to Qlik Analytics
- :
- Re: Help needed: Aggregating Product/Sales Data (M...
- Subscribe to RSS Feed
- Mark Topic as New
- Mark Topic as Read
- Float this Topic for Current User
- Bookmark
- Subscribe
- Mute
- Printer Friendly Page
- Mark as New
- Bookmark
- Subscribe
- Mute
- Subscribe to RSS Feed
- Permalink
- Report Inappropriate Content
Help needed: Aggregating Product/Sales Data (Min/Max Dates)
Hi,
We have data in the format below (but over hundreds of thousands of rows):
| Opportunity_ID | Opportunity_Name | Opportunity_Amount | Product_Name | Product_Amount | Revenue Start Date | Revenue Close Date |
| 1 | Opportunity 1 | 350000 | Product 1 | 25000 | 19/12/2016 | 04/05/2017 |
| 1 | Opportunity 1 | 350000 | Product 2 | 35000 | 19/12/2016 | 04/05/2017 |
| 1 | Opportunity 1 | 350000 | Product 3 | 40000 | 24/12/2016 | 04/05/2017 |
| 1 | Opportunity 1 | 350000 | Product 4 | 15000 | 19/12/2016 | 04/05/2017 |
| 1 | Opportunity 1 | 350000 | Product 5 | 65000 | 19/12/2016 | 04/05/2017 |
| 1 | Opportunity 1 | 350000 | Product 6 | 80000 | 19/12/2016 | 04/05/2017 |
| 1 | Opportunity 1 | 350000 | Product 7 | 50000 | 19/12/2016 | 04/05/2017 |
| 1 | Opportunity 1 | 350000 | Product 8 | 40000 | 19/12/2016 | 04/05/2017 |
To note,
- There is not a consistent start date across all products in an opportunity
- The same with close dates
The requirement is to output the data in the format:
| Opportunity_Name | Opportunity_Amount | Revenue Start Date | Revenue Close Date |
| Opportunity 1 | 350000 | 19/12/2016 | 04/05/2017 |
Here we are showing the opportunity data at an aggregated level, and showing the earliest corresponding revenue start and close date.
Attempting to replicate that in Qlik Sense produces the following:
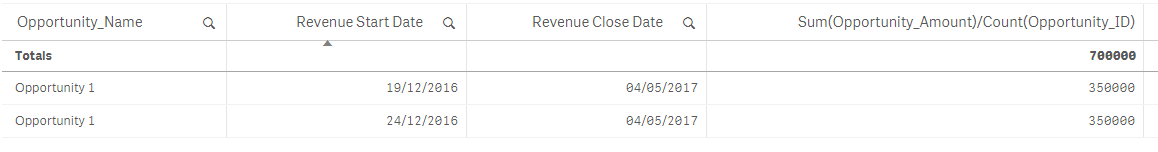
I don't want to see opportunity 1 appear twice, but just once with the earliest revenue start date. Seeing it twice also means we double count in the totals.
What is the best way of achieving the required output?
Please get back to me with any questions and thanks in advance!
Qlik User
- Mark as New
- Bookmark
- Subscribe
- Mute
- Subscribe to RSS Feed
- Permalink
- Report Inappropriate Content
Use Revenue Start and Close Dates as Measure instead of dimension
Date(Min([Revenue Start Date]))
Date(Max([Revenue Close Date]))
- Mark as New
- Bookmark
- Subscribe
- Mute
- Subscribe to RSS Feed
- Permalink
- Report Inappropriate Content
Thanks Sunny - I realised that there was a flag on one of the line items for each opportunity indicating the "opportunity start/close date", so I didn't actually need to implement such a condition.
A separate/unrelated question I was wondering if you can help with..
I want to show the top 10 highest revenue deals, with the rest being shown as "other" - How would I go about doing this in a table?