Unlock a world of possibilities! Login now and discover the exclusive benefits awaiting you.
- Qlik Community
- :
- Forums
- :
- Analytics
- :
- New to Qlik Analytics
- :
- Help needed for trend calculation
- Subscribe to RSS Feed
- Mark Topic as New
- Mark Topic as Read
- Float this Topic for Current User
- Bookmark
- Subscribe
- Mute
- Printer Friendly Page
- Mark as New
- Bookmark
- Subscribe
- Mute
- Subscribe to RSS Feed
- Permalink
- Report Inappropriate Content
Help needed for trend calculation
Hi all,
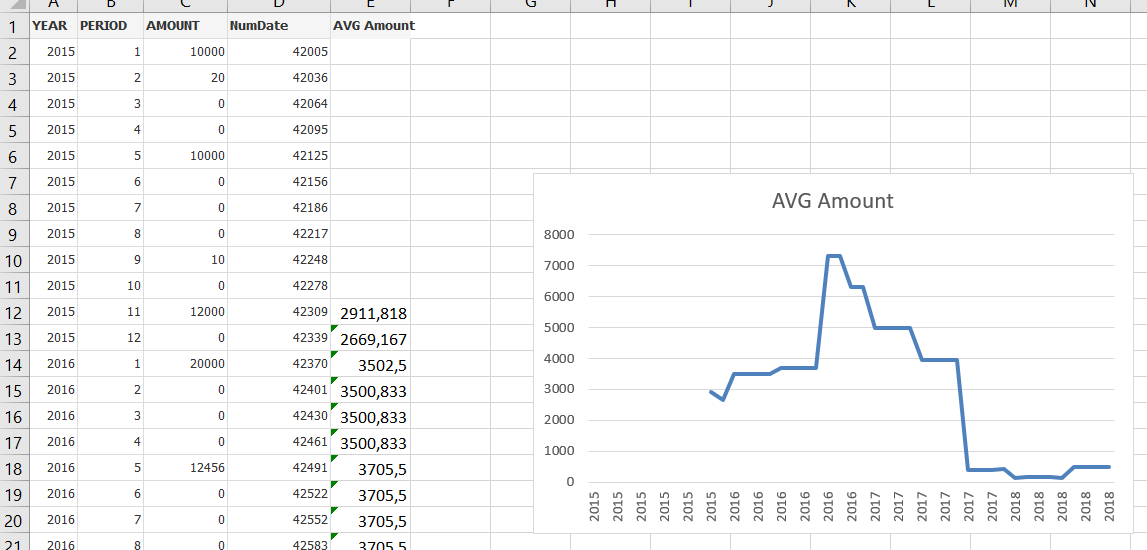
I have to calculate a trend based on an 12 month period. In the attachment you can find an Excelfile which has 4 columns and the fourth is what I'm looking for.
The first column is Year and the second the Period. If I create a bar chart I get a visualisation which my customer can not us. What he wants is a trend based on a 12 month average from an specific period.
Example
Sum({$<YEAR={"<=YEAR(TODAY())"}, Period={"<=ADDMONTHS(TODAY(),0)"}>}[AMOUNT]) this give the sum of 2018 and periode 0 to 8 but the set analysis is wrong. I'm struggling with the range and $.
But I want also have Period 9 to 12 from 2017 in my calculation.
Besides this, period 0 and 13 from every year must be excluded. In the source this is not possible because this is needed for other calculations. Solution can be to create a RESIDENT with a filter WHERE PERIOD >= '1' and PERIOD <= '12'
But let us first look the make the trend with period 0 and 13.
Can somebody help me with this? I would really appreciate it. If I have to clarify something, no problemo.
Greetings,
Martijn Wanders
Accepted Solutions
- Mark as New
- Bookmark
- Subscribe
- Mute
- Subscribe to RSS Feed
- Permalink
- Report Inappropriate Content
After a lot of hours I have the right numbers. In every table which is use to create the sum I added after load statement a distinct rule.
- Mark as New
- Bookmark
- Subscribe
- Mute
- Subscribe to RSS Feed
- Permalink
- Report Inappropriate Content
Hi Martijn,
What I did was transform your data a bit, to get the values between a possible date value.
To do so, i've put the 0 and 13 periods on their respective next month values, so 0 would go to period 1 and 13 would go to 12.
With that, you can create a date field for every year / month combination.
As on the visualization part, it goes like this for expression:
avg
(
{<
NumDate={">=$(=Num(AddMonths(Max(NumDate),-11)))<=$(=Max(NumDate))"}
>}
AMOUNT
)
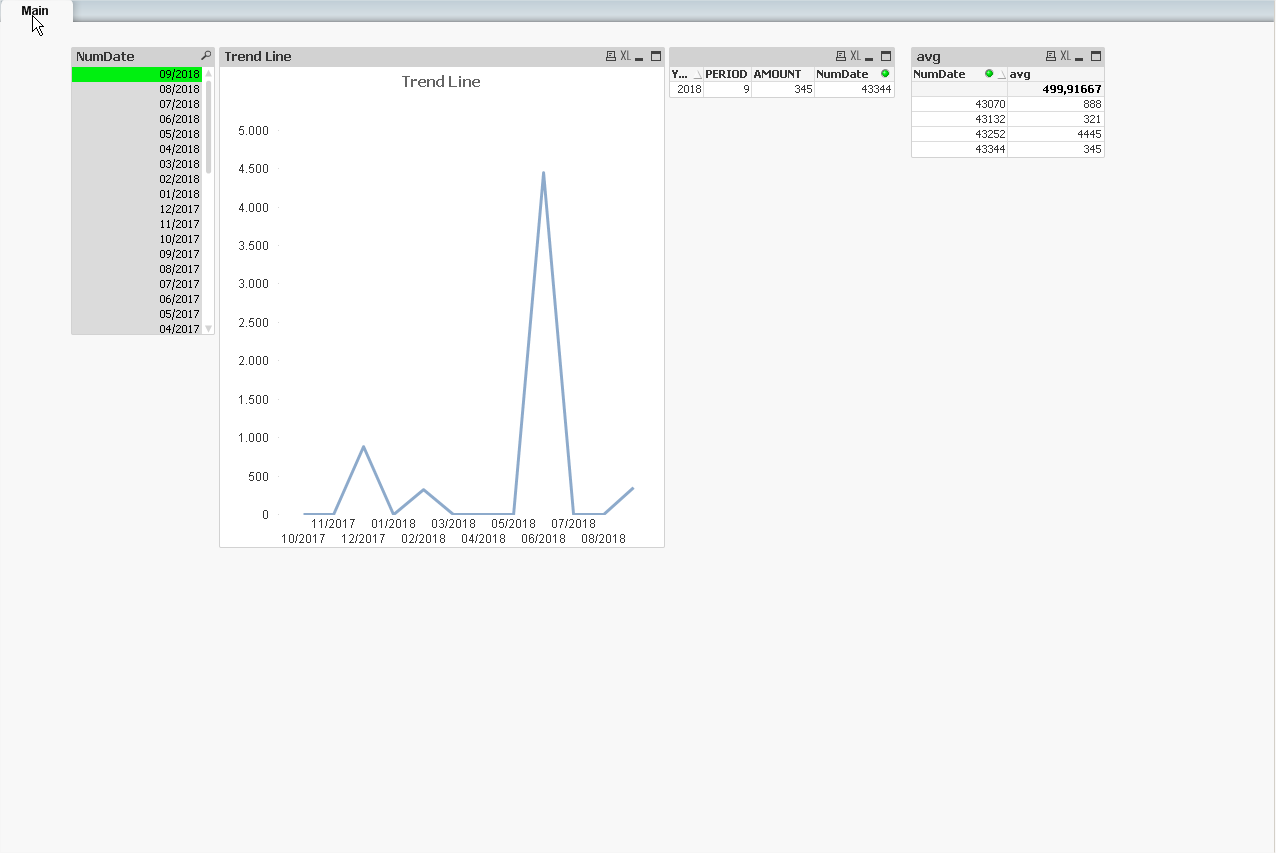
Attached the QVW i used.
- Mark as New
- Bookmark
- Subscribe
- Mute
- Subscribe to RSS Feed
- Permalink
- Report Inappropriate Content
Hi Felip,
Thank you very much for the first steps and I can see what you are doing. If I look to your chart it's not the same if I export the table to Excel and put an 12 month AVG column in it.
If I look to your formula I don't see something wrong. You take Max of NumDate minus 11 months. Then you take the Max of NumDate. With this range you take the AVG of Amount. Sounds very logical.
Can you see what we have to do to get the same line chart as below?
- Mark as New
- Bookmark
- Subscribe
- Mute
- Subscribe to RSS Feed
- Permalink
- Report Inappropriate Content
Hi Martij,
I've made an app that doesnt make sense.
I'm posting a new one with the concept you need.
It basically transforms the data so the current date has the accumulated value for past 11 months.
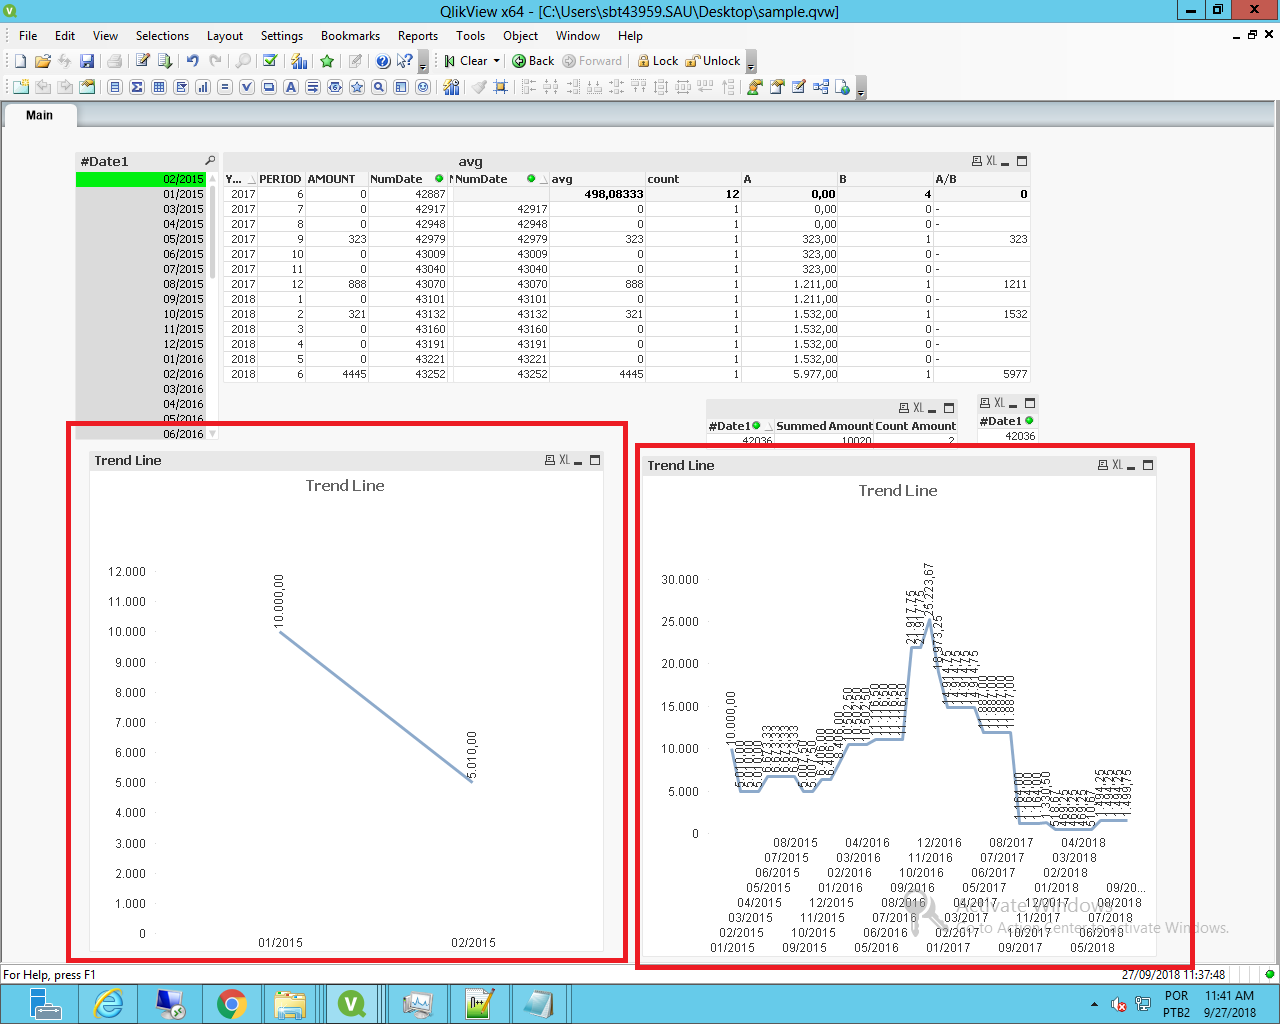
Left chart is using the #Date1 selection, so it shifts according to selection, and left on is the full trendline, removing the selection made.
Attached the QVW.
- Mark as New
- Bookmark
- Subscribe
- Mute
- Subscribe to RSS Feed
- Permalink
- Report Inappropriate Content
Hi Felip,
Yes, this is what I wanted. This weekend I tried to implement this in my script and is for 80% ok. My table to work with is slightly difficult than my example.
I am struggling with the last piece.
sumTable:
Load #Date1,
sum([Bedrag Saldo Test]) as [Summed Amount]
Resident tmpTable
Group by #Date1;
My table is a consolidation of 30 companies. So #Date1 is not unique and if I use SUM I get wrong values. I think it sum up everthing in the table with #Date1 but this field exists at every company.
I tried to make a key "CompanyNumber | #Date1" so it's unique and use this for GROUP BY. But still I get the same wrong values.
Do you have an idea to tackle this? Thank you for your help 🙂
Greetz,
Martijn Wanders
- Mark as New
- Bookmark
- Subscribe
- Mute
- Subscribe to RSS Feed
- Permalink
- Report Inappropriate Content
Has anybody has a clue what I can do to fix this sum?
- Mark as New
- Bookmark
- Subscribe
- Mute
- Subscribe to RSS Feed
- Permalink
- Report Inappropriate Content
After a lot of hours I have the right numbers. In every table which is use to create the sum I added after load statement a distinct rule.