Unlock a world of possibilities! Login now and discover the exclusive benefits awaiting you.
- Qlik Community
- :
- Forums
- :
- Analytics
- :
- New to Qlik Analytics
- :
- Re: Help to create table with measures coming from...
- Subscribe to RSS Feed
- Mark Topic as New
- Mark Topic as Read
- Float this Topic for Current User
- Bookmark
- Subscribe
- Mute
- Printer Friendly Page
- Mark as New
- Bookmark
- Subscribe
- Mute
- Subscribe to RSS Feed
- Permalink
- Report Inappropriate Content
Help to create table with measures coming from columns with same elements
Hi, not sure exactly how to ask this questions but I have the following data:
| Client | Region Type A | Region Type B | Revenue |
|---|---|---|---|
| A | West | West | 10 |
| B | East | West | 20 |
| C | East | North | 30 |
| D | East | East | 40 |
| E | South | South | 50 |
I would like the following report
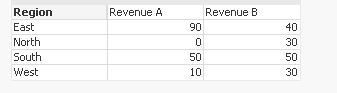
| Region | Revenue Type A | Revenue Type B |
|---|---|---|
| North | 0 | 30 |
| West | 10 | 30 |
| East | 90 | 40 |
| South | 50 | 50 |
Can you help?
Thanks,
Sam.
- Mark as New
- Bookmark
- Subscribe
- Mute
- Subscribe to RSS Feed
- Permalink
- Report Inappropriate Content
Try:
Dimension : valuelist('North','West','East','South')
Measure 1 - Revenue Type A :-
Pick(wildmatch(valuelist('North','West','East','South'),'North','West','East','South'),
sum({<[Revenue Type A] = {'North'}>}Revenue),
sum({<[Revenue Type A] = {'West'}>}Revenue),
sum({<[Revenue Type A] = {'East'}>}Revenue),
sum({<[Revenue Type A] = {'South'}>}Revenue)
)
Measure 2 - Revenue Type B :-
Pick(wildmatch(valuelist('North','West','East','South'),'North','West','East','South'),
sum({<[Revenue Type B] = {'North'}>}Revenue),
sum({<[Revenue Type B] = {'West'}>}Revenue),
sum({<[Revenue Type B] = {'East'}>}Revenue),
sum({<[Revenue Type B] = {'South'}>}Revenue)
)
- Mark as New
- Bookmark
- Subscribe
- Mute
- Subscribe to RSS Feed
- Permalink
- Report Inappropriate Content
Hi
I would restructure datamodel by doing following:
TableA:
Load
Client,
Region Type A as Region,
'A' as Type,
Revenue
From
YourSource
;
Concatenate(TableA)
Load
Client,
Region Type B as Region,
'B' as Type,
Revenue
From
YourSource
;
Then I would just build pivot table with:
Dimension
Region and Type
Measure
Sum(Revenue)
hth
cheers
- Mark as New
- Bookmark
- Subscribe
- Mute
- Subscribe to RSS Feed
- Permalink
- Report Inappropriate Content
Hi Sam,
You could do this way also:
LOAD
RegionA AS Region,
Revenue AS RevenueA,
0 AS RevenueB
FROM Table;
Concatenate
LOAD
RegionB AS Region,
0 AS RevenueA,
Revenue AS RevenueB
FROM Table ;
Then in the tab, you only need to use a pivot chart. Use sum(RevenueA) and sum(RevenueB) in the expression to achieve the format you need.
Thnaks
- Mark as New
- Bookmark
- Subscribe
- Mute
- Subscribe to RSS Feed
- Permalink
- Report Inappropriate Content
Thanks everyone for your response. My colleague Abhay was able to solve using crosstable - he may have additional comments below.
One more question (I think!)
Now we want to calculate the difference - any suggestions?
| Region | Revenue Type A | Revenue Type B | Difference |
|---|---|---|---|
| North | 0 | 30 | -30 |
| West | 10 | 30 | -20 |
| East | 90 | 40 | 50 |
| South | 50 | 50 | 0 |
- Mark as New
- Bookmark
- Subscribe
- Mute
- Subscribe to RSS Feed
- Permalink
- Report Inappropriate Content
Also FYI wanted to mention we are under a tight time pressure for this so that's why we're trying to avoid making lengthier (but likely better designed) changes. Its a simple model we are doing.
Thank you again for any help you can provide.
- Mark as New
- Bookmark
- Subscribe
- Mute
- Subscribe to RSS Feed
- Permalink
- Report Inappropriate Content
Hi
so by using "Crosstable" functionality you got to exactly the same output i was suggesting.
once you have this structure in order to deduct A-B you have to do following:
- Create a straight table chart
- Use dimension region
- use Expression Sum({<Type = {A}>} Revenue)-Sum({<Type={B}>}Revenue)
This would work if you would keep namings from my previous posts.
cheers
Lech