Unlock a world of possibilities! Login now and discover the exclusive benefits awaiting you.
- Qlik Community
- :
- Forums
- :
- Analytics
- :
- New to Qlik Analytics
- :
- Re: Help to group data in a PivotTable
- Subscribe to RSS Feed
- Mark Topic as New
- Mark Topic as Read
- Float this Topic for Current User
- Bookmark
- Subscribe
- Mute
- Printer Friendly Page
- Mark as New
- Bookmark
- Subscribe
- Mute
- Subscribe to RSS Feed
- Permalink
- Report Inappropriate Content
Help to group data in a PivotTable
Good afternoon Guys,
I have the following table and I'm breaking my head to account for my data correctly:
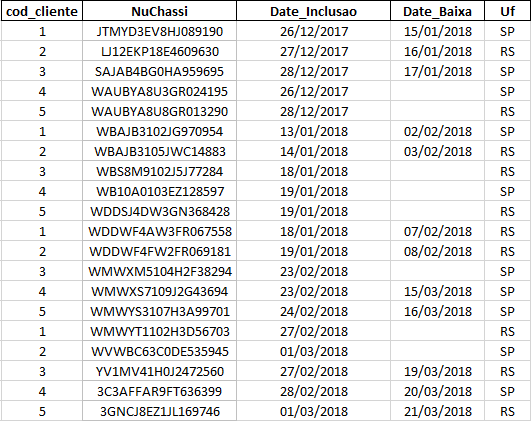
I need to count only the chassis that had lows (Date_Baixa = null) and group them by mm / yyyy of low and Uf of origin
it would be something like this:
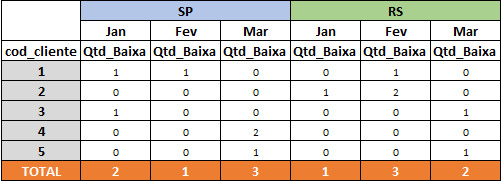
Can you give me an orientation?
- Mark as New
- Bookmark
- Subscribe
- Mute
- Subscribe to RSS Feed
- Permalink
- Report Inappropriate Content
Hi,
use cod_cliente, Uf, yearMonth as dimension,
and in your expression :
count({<NuChassi = E({<Date_Baixa = {'*'} >} ) >} NuChassi)
E() is to exclude, '*' for all whiche as a value : so you gat only nullvalues for date
regards
- Mark as New
- Bookmark
- Subscribe
- Mute
- Subscribe to RSS Feed
- Permalink
- Report Inappropriate Content
Can you please share excel sheet instead of snapshot? I will share the solution
- Mark as New
- Bookmark
- Subscribe
- Mute
- Subscribe to RSS Feed
- Permalink
- Report Inappropriate Content
Rafael,
Você pode criar uma pivot table com:
Dimensões:
mês/ano - supondo que você a tenha criado no script monthname(Campo_Data);
cod_cliente;
uf;
Expressão: NullCount(data_baixa)
Abs e Sucesso!!
Farol BI
WhatsApp: 24 98152-1675
Skype: justen.thiago
- Mark as New
- Bookmark
- Subscribe
- Mute
- Subscribe to RSS Feed
- Permalink
- Report Inappropriate Content
Thank you guys, It worked well.