Unlock a world of possibilities! Login now and discover the exclusive benefits awaiting you.
- Qlik Community
- :
- Forums
- :
- Analytics
- :
- New to Qlik Analytics
- :
- Help with Conditionally coloring percentages
- Subscribe to RSS Feed
- Mark Topic as New
- Mark Topic as Read
- Float this Topic for Current User
- Bookmark
- Subscribe
- Mute
- Printer Friendly Page
- Mark as New
- Bookmark
- Subscribe
- Mute
- Subscribe to RSS Feed
- Permalink
- Report Inappropriate Content
Help with Conditionally coloring percentages
Hi all, I was wondering if anyone could help me with this formula.
My first formula works...here it is.
Num(Count({<test_score = {">=4"}>} test_score) /Count(test_score),'0%')
This is giving me a KPI with a percentage of how many test scores are over 4.
I wanted to conditionally color it based on how high the percentage is. This is the part I am having a difficult time with.
=if(([test_score]) >= 60, rgb(132,186,8))
=if(([test_score]) >=31 and <-59 rgb(255,203,85))
=if(([test_score]) <= 30, rgb(247,77,49))
Can anyone help me to get this to work? I think the first and 3rd lines work but I am not sure how to get this range between 31 and 59 to work.
Thanks,
Jordan
Accepted Solutions
- Mark as New
- Bookmark
- Subscribe
- Mute
- Subscribe to RSS Feed
- Permalink
- Report Inappropriate Content
It's way simpler than that
use a KPI object;
as an expression :
Count({<test_score = {">=4"}>} test_score) /Count(test_score)
don't use the num to format it; you can format it using qlik sense options:
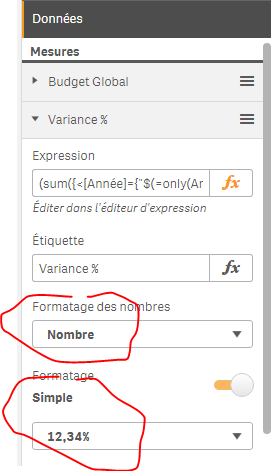
NOW? YOUR MEASURE WOULD BE FROM 0 TO 1
to color it:
under color, activate conditionnal colors; add 2 new limiters 0.3 and 0.6; and then qlik on the bar to choose ur colors:

- Mark as New
- Bookmark
- Subscribe
- Mute
- Subscribe to RSS Feed
- Permalink
- Report Inappropriate Content
It's way simpler than that
use a KPI object;
as an expression :
Count({<test_score = {">=4"}>} test_score) /Count(test_score)
don't use the num to format it; you can format it using qlik sense options:
NOW? YOUR MEASURE WOULD BE FROM 0 TO 1
to color it:
under color, activate conditionnal colors; add 2 new limiters 0.3 and 0.6; and then qlik on the bar to choose ur colors:
- Mark as New
- Bookmark
- Subscribe
- Mute
- Subscribe to RSS Feed
- Permalink
- Report Inappropriate Content
Thanks Omar. That appears to have worked.