Unlock a world of possibilities! Login now and discover the exclusive benefits awaiting you.
- Qlik Community
- :
- Forums
- :
- Analytics
- :
- New to Qlik Analytics
- :
- Re: Help with date data selection.
- Subscribe to RSS Feed
- Mark Topic as New
- Mark Topic as Read
- Float this Topic for Current User
- Bookmark
- Subscribe
- Mute
- Printer Friendly Page
- Mark as New
- Bookmark
- Subscribe
- Mute
- Subscribe to RSS Feed
- Permalink
- Report Inappropriate Content
Help with date data selection.
I have these as my expressions:
Sum({<Year = {">=$(=min((EndYear)-1))<=$(=max((EndYear)-1))"}>}[Population, total]
Sum({<Year = {">=$(=min(EndYear))<=$(=max(EndYear))"}>}[Population, total]
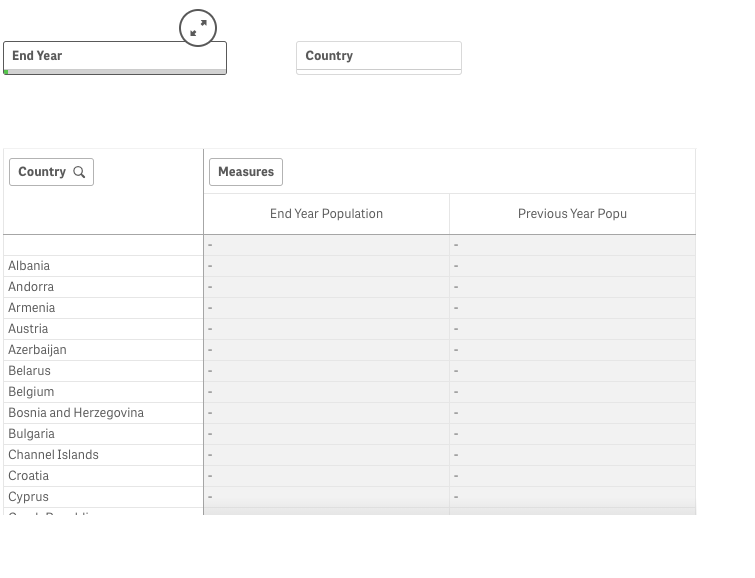
The whole point is I would like to achieve or fill the pivot with population values of the end year.
I tried using the same expression to create variables but still its not working.
In the end I need achieve (End Year Population - Previous Year Population)/Previous year )*100
Any help very much appreciated.
Michael
Accepted Solutions
- Mark as New
- Bookmark
- Subscribe
- Mute
- Subscribe to RSS Feed
- Permalink
- Report Inappropriate Content
May be try this
Sum({<Year = {">=$(=min((EndYear)-1))<=$(=max((EndYear)-1))"}, StartYear, EndYear>}[Population, total])
Sum({<Year = {">=$(=min(EndYear))<=$(=max(EndYear))"}, StartYear, EndYear>}[Population, total])
- Mark as New
- Bookmark
- Subscribe
- Mute
- Subscribe to RSS Feed
- Permalink
- Report Inappropriate Content
Year and EndYear are two fields in your dashboard?
- Mark as New
- Bookmark
- Subscribe
- Mute
- Subscribe to RSS Feed
- Permalink
- Report Inappropriate Content
Year is in the original table. So I created two extra tables ; StartYear and EndYear to help with filtering and Year range selections.
So anywhere within the dashboard am not using Year, but rather using EndYear field or StartYear field. for graphs plotting mainly (year range)
On this specific one.. I just need to pick the most current year which am picking using the EndYear filter.
- Mark as New
- Bookmark
- Subscribe
- Mute
- Subscribe to RSS Feed
- Permalink
- Report Inappropriate Content
May be try this
Sum({<Year = {">=$(=min((EndYear)-1))<=$(=max((EndYear)-1))"}, StartYear, EndYear>}[Population, total])
Sum({<Year = {">=$(=min(EndYear))<=$(=max(EndYear))"}, StartYear, EndYear>}[Population, total])
- Mark as New
- Bookmark
- Subscribe
- Mute
- Subscribe to RSS Feed
- Permalink
- Report Inappropriate Content
 Legend.