Unlock a world of possibilities! Login now and discover the exclusive benefits awaiting you.
- Qlik Community
- :
- Forums
- :
- Analytics
- :
- New to Qlik Analytics
- :
- Historical Calculations Based on Multiple Event Ta...
- Subscribe to RSS Feed
- Mark Topic as New
- Mark Topic as Read
- Float this Topic for Current User
- Bookmark
- Subscribe
- Mute
- Printer Friendly Page
- Mark as New
- Bookmark
- Subscribe
- Mute
- Subscribe to RSS Feed
- Permalink
- Report Inappropriate Content
Historical Calculations Based on Multiple Event Tables
I am creating a Sense application to review Portfolio At Risk for partner lending operations, and I need to be able to display historical rates for a few categories of risk, segmented by lender. I have two goals here:
- A line graph with three lines, PAR-7, PAR-14, and PAR-21, defined as the sum of remaining loan value in default for at least 7, 14, and 21 days, with historical dates on the x-axis.
- A bar graph with PAR-n (1-180) as a dimension and the sum of the amount outstanding as the measure. I'm going to include a date picker to allow the user to define any date and then view the PAR position as it was on that date.
I could conceivably run this calculation in SQL to return one row per day in the historical record, per partner lender, with the sum of loan value outstanding in each category in the following columns. However, I'd like to try to get this done inside Qlik for a few reasons:
- I have a "likelihood of recovery" calculation based on the number of days in default I'd like to make against each account, so aggregates aren't great
- I am pulling most of this information from .QVD files, so I can't very well use SQL against them. (I could use SQL against the source database for these files, but the load time would be extended considerably)
- I would be unable to construct Graph #2 based on this data; it would need to be one row per distributor per day in the historical record per hypothetical days in default: in other words, a deeply inefficient query and a huge, denormalized result table.
I have the following relevant tables in my data model so far:
[Accounts]:
account_id,
organization_id,
total_loan_value_usd,
registration_date
[Organizations]:
organization_id,
organization_name
[Account State Transitions]:
transition_id,
account_id,
to_state,
started_when,
ended_when (this field is null in the case of the most recent transition)
[Payments]:
account_id,
amount_usd,
effective_when
To effect the charts I want, I need:
- A date dimension: I'm thinking I need a "Master Calendar" to handle this, but that means renaming each of effective_when, started_when, and registration_date as "master_date" or something to that effect, which seems like it would make the following calculations impossible:
- Total Portfolio Value:Sum of [Accounts].total_loan_value_usd - Sum of [Payments].amount_usd WHERE:
- [Accounts].registration_date <= master_date
- AND [Payments].effective_when <= master_date
- [Accounts].registration_date <= master_date
- PAR-7: Sum of [Accounts].total_loan_value_usd of all accounts - Sum of [Payments].amount_usd WHERE:
- [Accounts].registration_date <= master_date
- AND [Payments].effective_when is <= master_date
- AND the most recent entry prior to the date dimension in [Account State Transitions] based on .started_date has both:
- [Account State Transitions].to_state like 'DISABLED'
- AND master_date - [Account State Transitions].started_when >= 7 days
- Or, in plain English: the sum of loan amounts with registration date prior to master_date, minus the sum of payments prior to master_date, where the most recent transition prior to the date dimension matches the term 'DISABLED' AND where the difference in whole days between master_date and started_when is at least 7.
- PAR-14, PAR-21: As PAR-7, but with the interval constraint upped to 14 and 21 days.
So my specific questions are:
- Is generating a Master Calendar with a "type" field indicating the event type going to allow me to perform the calculations I need to build out the PAR values? How should my data model be organized in that hypothetical?
- Any specific help building the calculations for Total Portfolio Value and PAR-n would be much appreciated. I'm guessing I need Set analysis here along with the FirstSortedValue() function, but I'm not really sure where to begin.
Thanks!
- Mark as New
- Bookmark
- Subscribe
- Mute
- Subscribe to RSS Feed
- Permalink
- Report Inappropriate Content
Check this out, since you have multiple dates involved -
- Mark as New
- Bookmark
- Subscribe
- Mute
- Subscribe to RSS Feed
- Permalink
- Report Inappropriate Content
Thanks for the quick reply, digvijay!
If I understand the canonical date article, however, this strategy requires that one of the tables in the data model must be "a table where each record only has one value of each date type associated." Unfortunately, in my data, any given Account can have many Payments and many Transitions, Payments have one Account but many relevant Transitions, and Transitions have one Account but many relevant Payments.
Do you have any advice for adapting this strategy in the context of that constraint? Thanks again!
Edit: I don't really see why I shouldn't connect to Accounts; what am I going to break if I build a DateBridge table that has one row per account per relevant date, such that an account with it's own registration_date, 5 effective_date(s), and 5 started_when(s) would appear as 11 total rows on the DateBridge table?
- Mark as New
- Bookmark
- Subscribe
- Mute
- Subscribe to RSS Feed
- Permalink
- Report Inappropriate Content
If you can share sample data and expected output, I could try few things, it helps in receiving better and more responses over here.
- Mark as New
- Bookmark
- Subscribe
- Mute
- Subscribe to RSS Feed
- Permalink
- Report Inappropriate Content
I've attached a qvf with some sample data so you can see a sample of the load script I have so far. (You'll notice I slightly simplified my original schema description and didn't mention the fact that the amount_usd actually lives on a Receipts table that has a 1:1 relationship with Payments for our purposes)
My thinking now is that I ought to create a single master Event table that lists registrations, payments, and transitions all together with a single date column, construct a "master" calendar against each of the categories of Events and a "canonical" calendar against the entire Events table.
My desired outcome is two-fold:
- Line graphs with the Total Portfolio Value, PAR-7, PAR-14, and PAR-21 graphed over time.
- The ability to pick any one date and see a bar graph with the sum of amounts remaining as the measure and the number of days at risk as the dimension as it was on the selected date. (Accounts whose most recent Transition has "to_state" like 'DISABLED' are at risk, and the amount of time between the start of the DISABLED transition and the selected date is the number of days in which it has been at risk)
#1 is a higher priority than #2 for me, so if there's a schema that gets us to #1 but not #2 I'm very much interested.
- Mark as New
- Bookmark
- Subscribe
- Mute
- Subscribe to RSS Feed
- Permalink
- Report Inappropriate Content
Update: Here is my new schema:
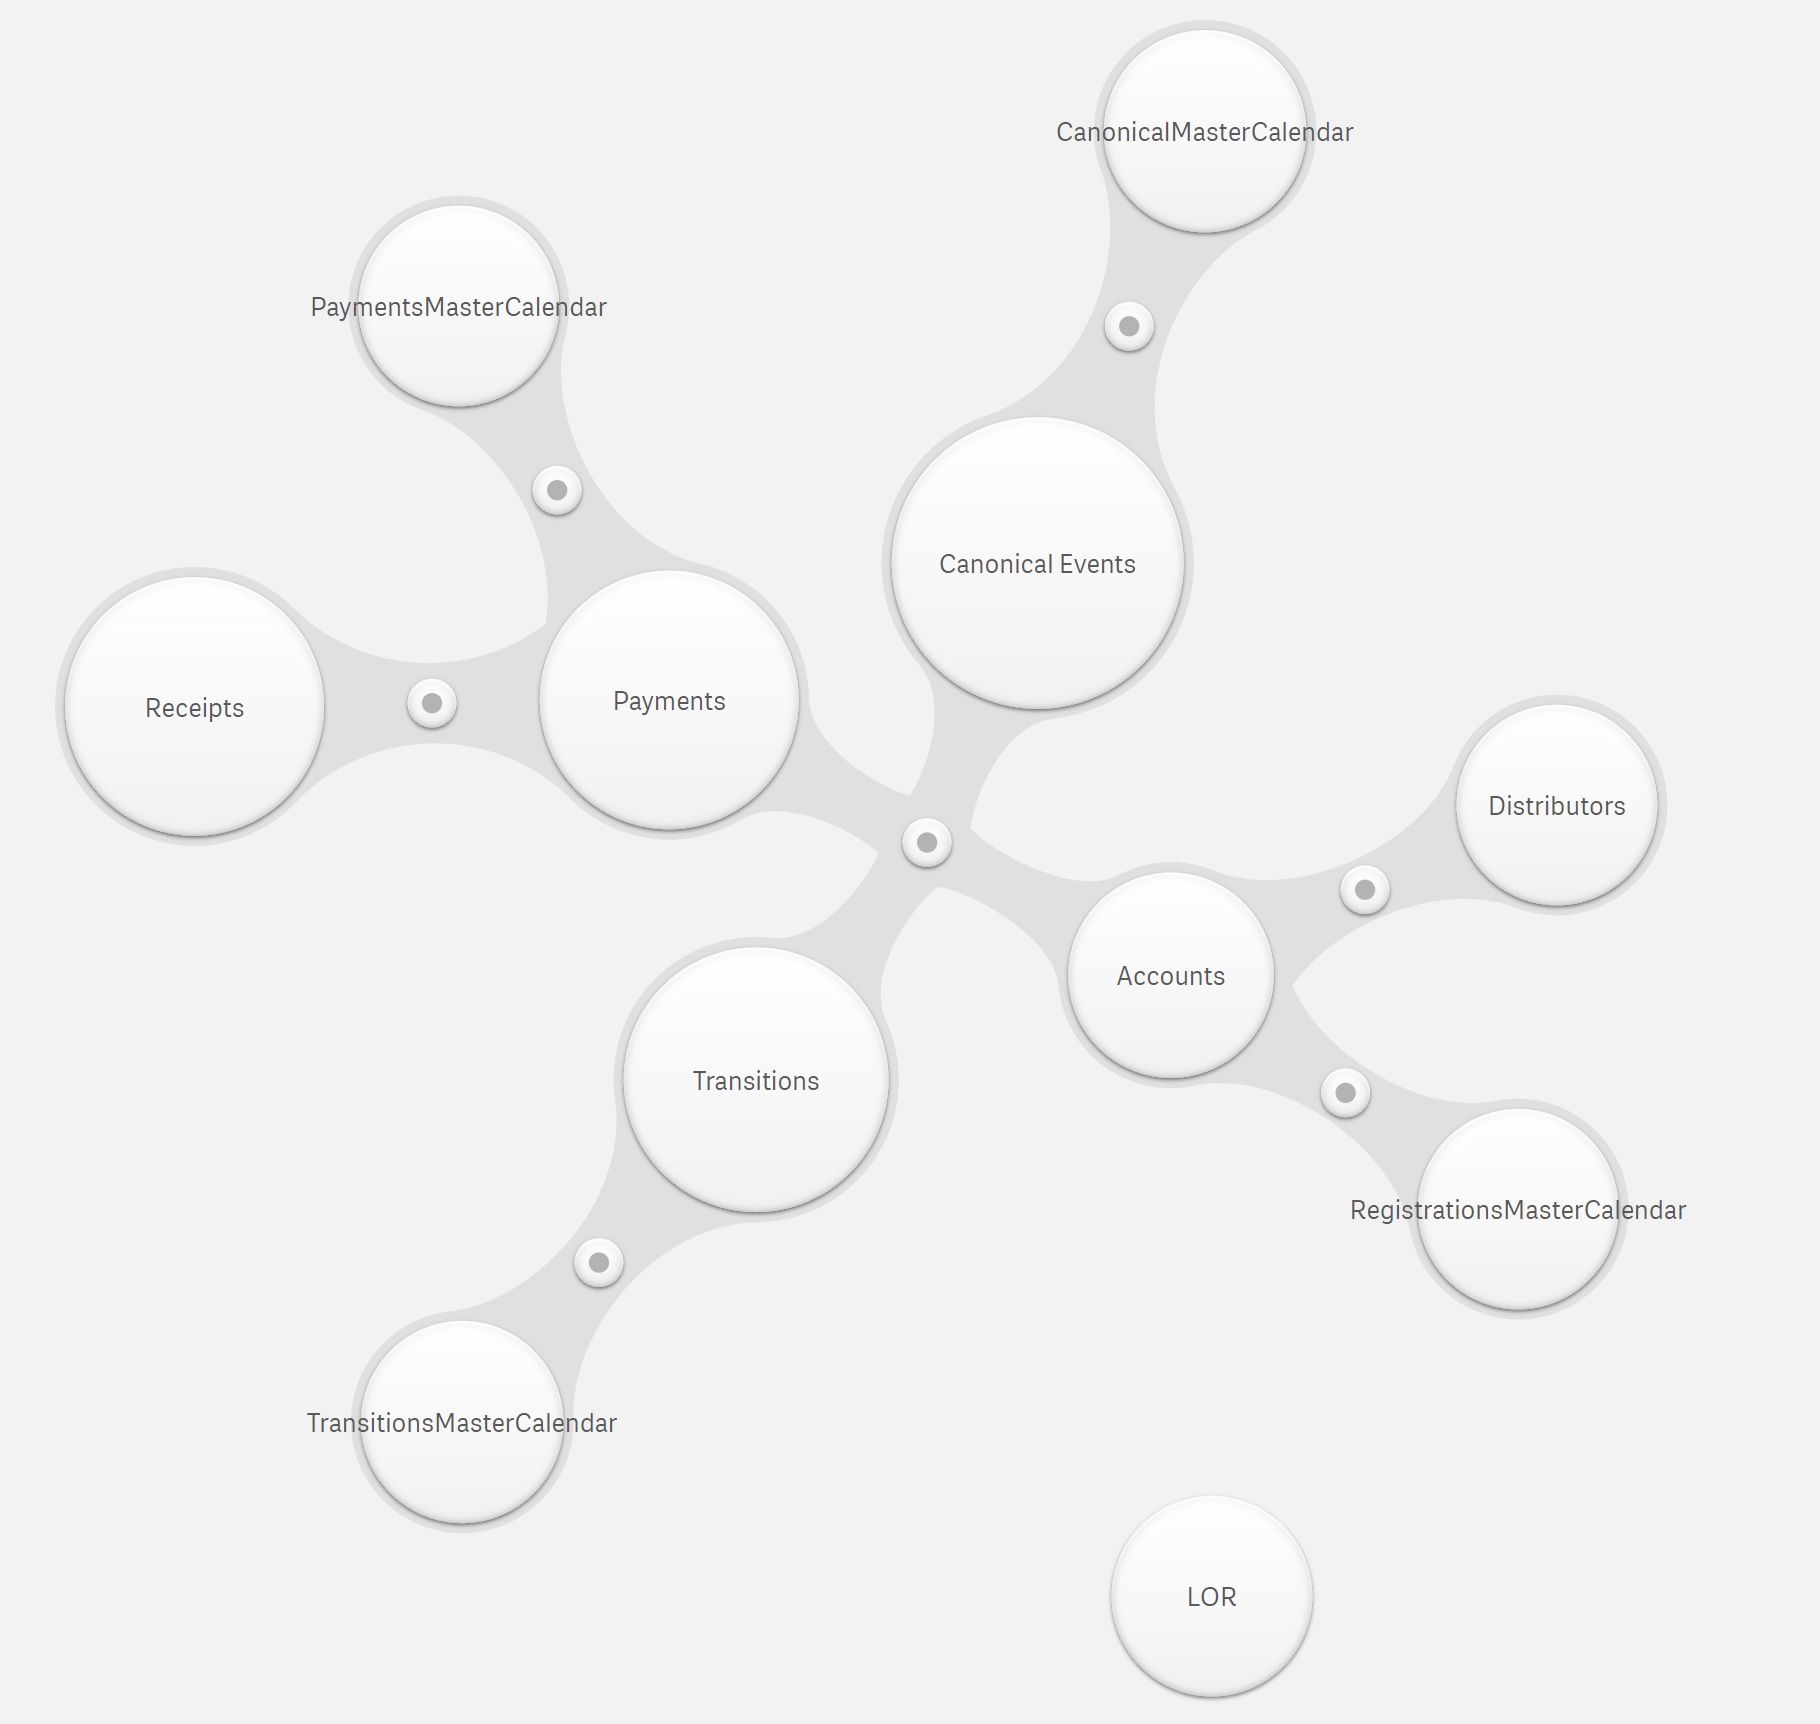
"Canonical Events" is a concatenation of the three types of events I have in Accounts, Transitions, and Payments, with a Type column. "LOR" is just a two-column table that returns the Likelihood of Recovery for a generic account given a certain number of whole days of default.
I'm putting together a graph to show the total amount outstanding by Distributor and by Account State, but I've run into a wall with trying to Dimension the most recent Transition's "to_state" per account. I'm trying to put together a bar graph with Distributor Name as the first dimension and the current status of all the Distributor's accounts as the second dimension. Looking through a few blog posts, it sounds like FirstSortedValue() and possibly Aggr() are necessary, but I can't seem to get these to work.
First I tried:
=FirstSortedValue(to_state, -transition_started_date)
On the grounds that I'm looking for the "to_state" of the most recent transition, and the dimensions are already separating things out based on Distributor name. I realize this would probably fail to segment the results by Account, but I can't tell what the result is because I simply get an "Invalid dimension" error on the chart. (Which is a sublimely useless error message)
Then I read more and realized I probably need an Aggr() statement to create the values which FirstSortedValue will evaluate, and I tried this:
=firstsortedvalue(to_state, -aggr(transition_started_date, account_id))
On the grounds that I want to find the most recent to_state across each group of transition_started_dates, grouped by account_id.
I am still getting the "Invalid dimension" error 
Any guidance on how I can get this dimension to work would be great, (or a method for accomplishing the same thing using a Measure and Set analysis) and bonus rep to anyone who can figure out a way to do it that allows me to include a variable defining the maximum date that should be considered for the purpose of the evaluation. (Eventually I'll want to be able to restrict this calculation based on a date selected by the user in order to display the measure in question as it would have appeared on the selected day)