Unlock a world of possibilities! Login now and discover the exclusive benefits awaiting you.
- Qlik Community
- :
- Forums
- :
- Analytics
- :
- New to Qlik Analytics
- :
- Re: Horizontal Area Line Chart
- Subscribe to RSS Feed
- Mark Topic as New
- Mark Topic as Read
- Float this Topic for Current User
- Bookmark
- Subscribe
- Mute
- Printer Friendly Page
- Mark as New
- Bookmark
- Subscribe
- Mute
- Subscribe to RSS Feed
- Permalink
- Report Inappropriate Content
Horizontal Area Line Chart
Hi guys,
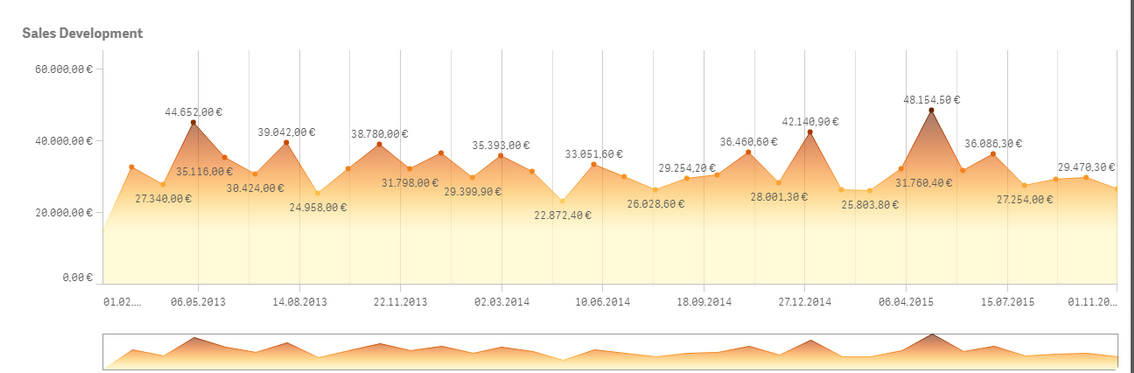
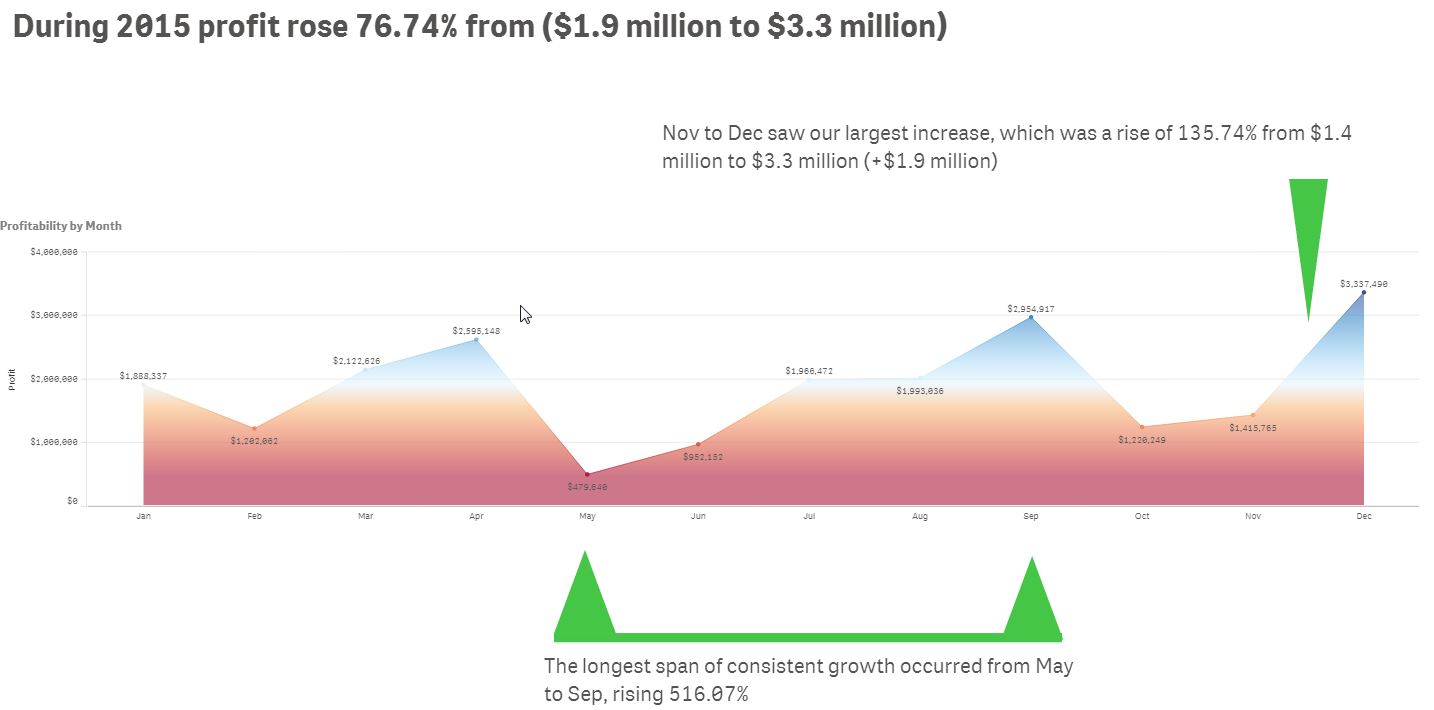
I was wondering how to mak the area coloring in a line chart horizontal, like this:
Accepted Solutions
- Mark as New
- Bookmark
- Subscribe
- Mute
- Subscribe to RSS Feed
- Permalink
- Report Inappropriate Content
Hi Guys - / Guven - here is an update on this for you:
It was possible until version 3.1, then it wasn’t possible until this February release (which will be out shortly) we added back due to popular demand.
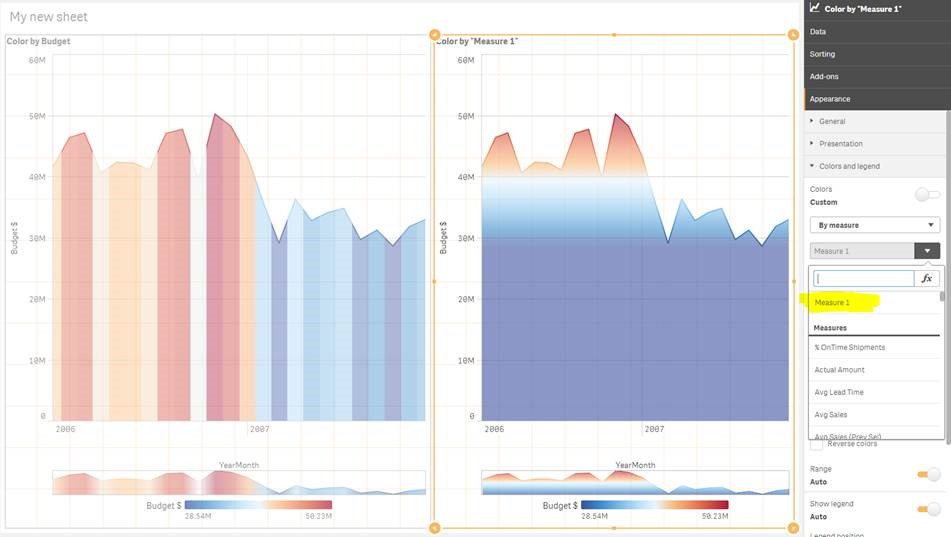
What happened in 3.1 was that we added the ability to color by any measure which meant that we could no longer color from the top down, but rather from side to side. Not sure that makes sense, but it was a limitation we had to live with.
For the February release we’ve added the option in color by to color by currently used dimension/measure and using this setting you will then get back the gradient. The benefit of coloring by currently used dimension/measure is also that when a user has alternative data we can keep on coloring it by what dimension is being used. Like in a pie chart when you switch dimension we will also switch the dimension we color by.
ou could also say that we now have the option to color by “relative” data instead of “absolute”.
Hope this helps
When applicable please mark the appropriate replies as CORRECT. This will help community members and Qlik Employees know which discussions have already been addressed and have a possible known solution. Please mark threads as HELPFUL if the provided solution is helpful to the problem, but does not necessarily solve the indicated problem. You can mark multiple threads as HELPFUL if you feel additional info is useful to others.
Regards,
Michael Tarallo (@mtarallo) | Twitter
Mike Tarallo
Qlik
- Mark as New
- Bookmark
- Subscribe
- Mute
- Subscribe to RSS Feed
- Permalink
- Report Inappropriate Content
Hi guventum,
Do you know if the images above are being produced by a Qlik Sense extension? I don't believe you can achieve that 'vertical gradient' color coding within the default color properties of a line area chart.
Regards,
- Mark as New
- Bookmark
- Subscribe
- Mute
- Subscribe to RSS Feed
- Permalink
- Report Inappropriate Content
mto, if u have insights on how to do this; please share 
- Mark as New
- Bookmark
- Subscribe
- Mute
- Subscribe to RSS Feed
- Permalink
- Report Inappropriate Content
Let me find out
Mike Tarallo
Qlik
- Mark as New
- Bookmark
- Subscribe
- Mute
- Subscribe to RSS Feed
- Permalink
- Report Inappropriate Content
I got the example from this website : https://community.dynamics.com/nav/b/prismainformatikerpandbinewsroom/archive/2016/09/21/fast-and-si...
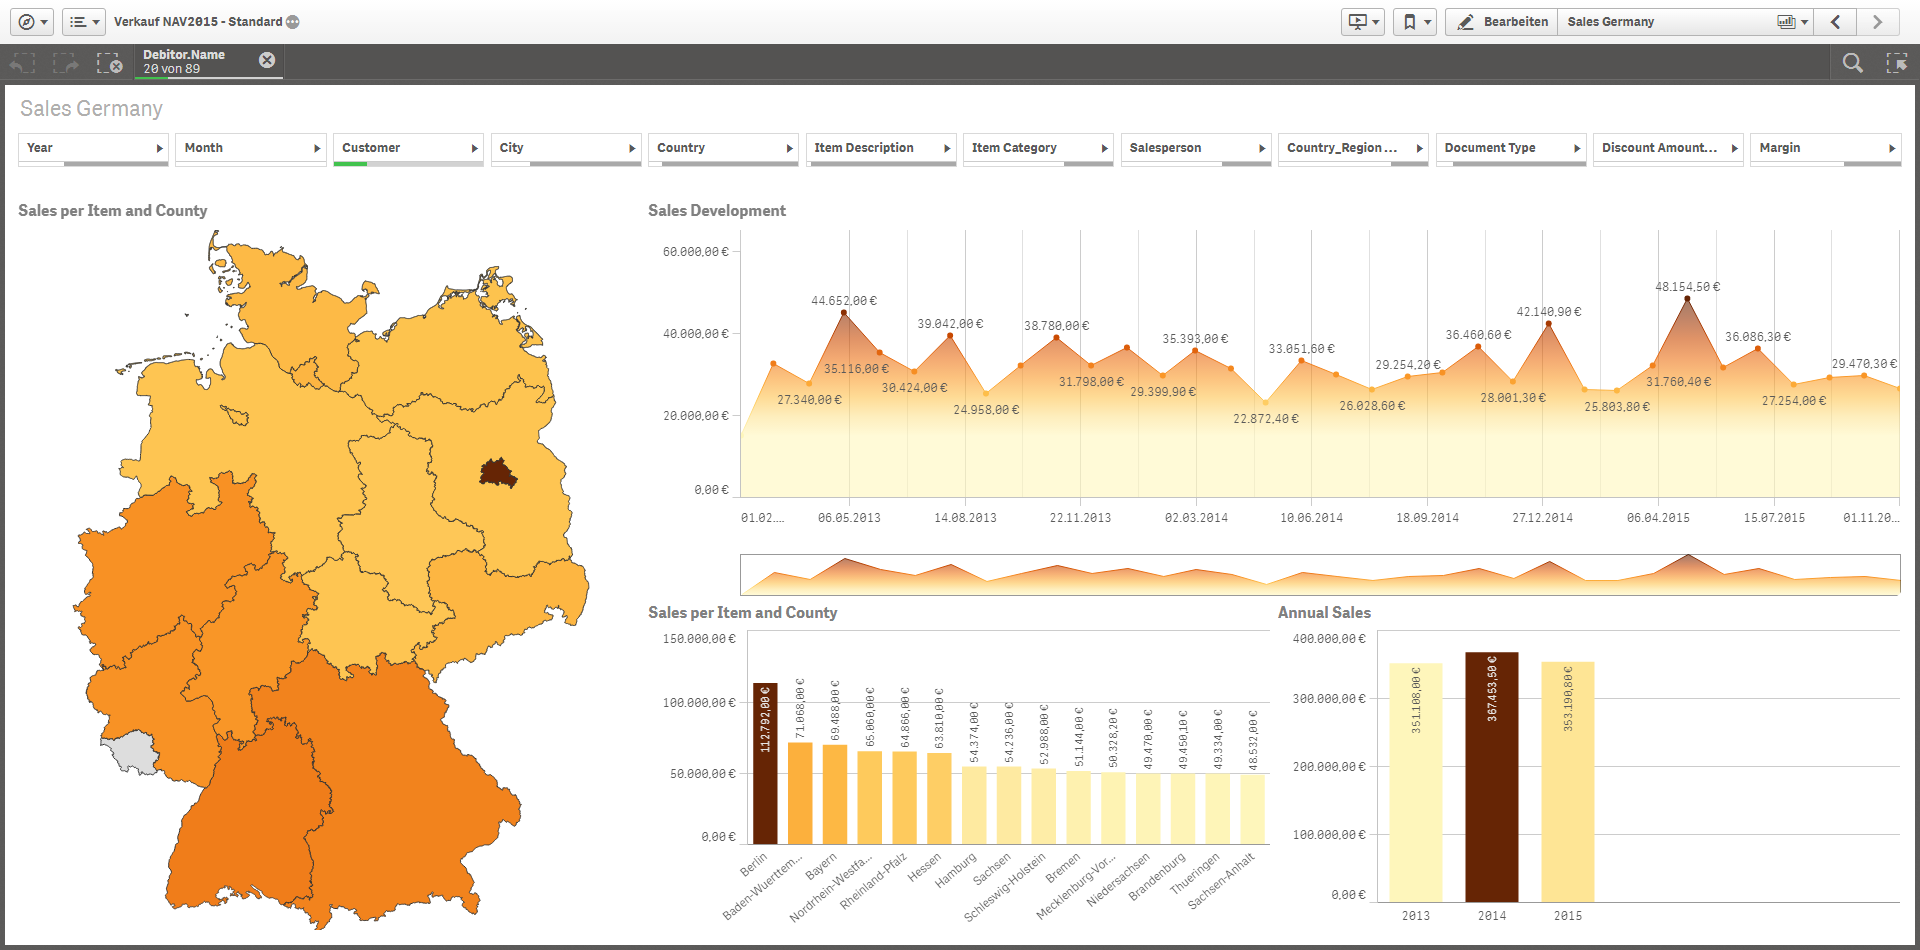
To be honest, it does not look like an extension.
- Mark as New
- Bookmark
- Subscribe
- Mute
- Subscribe to RSS Feed
- Permalink
- Report Inappropriate Content
Hi Guys - / Guven - here is an update on this for you:
It was possible until version 3.1, then it wasn’t possible until this February release (which will be out shortly) we added back due to popular demand.
What happened in 3.1 was that we added the ability to color by any measure which meant that we could no longer color from the top down, but rather from side to side. Not sure that makes sense, but it was a limitation we had to live with.
For the February release we’ve added the option in color by to color by currently used dimension/measure and using this setting you will then get back the gradient. The benefit of coloring by currently used dimension/measure is also that when a user has alternative data we can keep on coloring it by what dimension is being used. Like in a pie chart when you switch dimension we will also switch the dimension we color by.
ou could also say that we now have the option to color by “relative” data instead of “absolute”.
Hope this helps
When applicable please mark the appropriate replies as CORRECT. This will help community members and Qlik Employees know which discussions have already been addressed and have a possible known solution. Please mark threads as HELPFUL if the provided solution is helpful to the problem, but does not necessarily solve the indicated problem. You can mark multiple threads as HELPFUL if you feel additional info is useful to others.
Regards,
Michael Tarallo (@mtarallo) | Twitter
Mike Tarallo
Qlik
- Mark as New
- Bookmark
- Subscribe
- Mute
- Subscribe to RSS Feed
- Permalink
- Report Inappropriate Content
Hi @mto,
Glad to see it back in the February release. Thanks for the heads up. Keep up the great work!
Xavi
- Mark as New
- Bookmark
- Subscribe
- Mute
- Subscribe to RSS Feed
- Permalink
- Report Inappropriate Content
Wow, thanks! Nice work.
- Mark as New
- Bookmark
- Subscribe
- Mute
- Subscribe to RSS Feed
- Permalink
- Report Inappropriate Content
I also thought it was possible in previous versions ! I think you've even done a video in the 2.x releases on such a thing!
Ps: I've tried it yesterday with the February preview release and wasn't able to do it.. have to recheck it by night once home!