Unlock a world of possibilities! Login now and discover the exclusive benefits awaiting you.
- Qlik Community
- :
- Forums
- :
- Analytics
- :
- New to Qlik Analytics
- :
- Re: How can I limit number of bars in a chart?
- Subscribe to RSS Feed
- Mark Topic as New
- Mark Topic as Read
- Float this Topic for Current User
- Bookmark
- Subscribe
- Mute
- Printer Friendly Page
- Mark as New
- Bookmark
- Subscribe
- Mute
- Subscribe to RSS Feed
- Permalink
- Report Inappropriate Content
How can I limit number of bars in a chart?
HI !
I want to show only the last 12 months in a bar chart. Is it possible?
Best regards,
Ciro.
Accepted Solutions
- Mark as New
- Bookmark
- Subscribe
- Mute
- Subscribe to RSS Feed
- Permalink
- Report Inappropriate Content
You can try using a set analysis expressions to limit the number of months. If you have a date field then you can use something like sum({<MyDate={'>=$(=MonthStart(Max(MyDate),-11))'}>} Value) to calculate the sum of Value using only the date values from the last 12 months.
If you need more help please post a small Qlik Sense app that illustrates the problem.
talk is cheap, supply exceeds demand
- Mark as New
- Bookmark
- Subscribe
- Mute
- Subscribe to RSS Feed
- Permalink
- Report Inappropriate Content
Hi CIRO,
You can achieve this by an expression as Gysbert mentioned. There is also an alternative to this which can be easier,
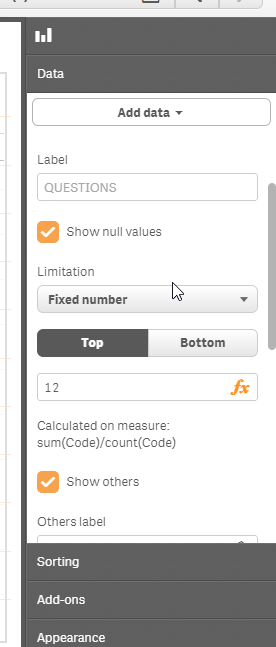
In the properties panel, first sort the dimmenion by Months and then set the limitation dropdown to Fixed number and enter in 12 there. This will curtail the output to just last 12 months.
Thanks,
Sangram.
- Mark as New
- Bookmark
- Subscribe
- Mute
- Subscribe to RSS Feed
- Permalink
- Report Inappropriate Content
Hi Gysbert!
Thank you for your help.
Best regards,
Ciro.
- Mark as New
- Bookmark
- Subscribe
- Mute
- Subscribe to RSS Feed
- Permalink
- Report Inappropriate Content
Hi Sangram!
Thank you for your help.
Your reply is correct too, bud I don't know how mark it as a correct answer.
Best regards,
Ciro.
- Mark as New
- Bookmark
- Subscribe
- Mute
- Subscribe to RSS Feed
- Permalink
- Report Inappropriate Content
Glad it helped! 