Unlock a world of possibilities! Login now and discover the exclusive benefits awaiting you.
- Qlik Community
- :
- Forums
- :
- Analytics
- :
- New to Qlik Analytics
- :
- How can I reference the values from Dimensions in ...
- Subscribe to RSS Feed
- Mark Topic as New
- Mark Topic as Read
- Float this Topic for Current User
- Bookmark
- Subscribe
- Mute
- Printer Friendly Page
- Mark as New
- Bookmark
- Subscribe
- Mute
- Subscribe to RSS Feed
- Permalink
- Report Inappropriate Content
How can I reference the values from Dimensions in set analysis?
Hi all,
I was hoping to tap into your knowledge for help with this issue I'm having.
What I'm trying to do is with set analysis measure the decline in user activity, using a log of transactions.
The logic is that any user that completed a transaction last month and hasn't done any this month should be counted against the month they're missing from.
To help, I've created a field called "LapseTransactionMonth". This field is the transaction created month forward-dated by 1 month.
So, the basic code would be:
//All users with transactions in the previous month
Count({<LapseTransactionMonth = {"=CurrentMonth"}>} Distinct UserID) -
//Subtract subset of users with transactions this month
Count({<LapseTransactionMonth = {"=CurrentMonth"}, TransactionMonth = {"=(CurrentMonth)"} >} Distinct UserID)
Note, CurrentMonth is meant to signify the month dimension on the visualisation; so if there are 7 months worth of data, this formula should be applied to each of them.
Sofar, I've not been able to crack this.
Thank you for your help.
Sven
- « Previous Replies
-
- 1
- 2
- Next Replies »
- Mark as New
- Bookmark
- Subscribe
- Mute
- Subscribe to RSS Feed
- Permalink
- Report Inappropriate Content
Perhaps this document helps: set_analysis_intra-record.qvw
talk is cheap, supply exceeds demand
- Mark as New
- Bookmark
- Subscribe
- Mute
- Subscribe to RSS Feed
- Permalink
- Report Inappropriate Content
Thanks Gysbert, but I'm using Qlik Sense and can't open the attachment to see the formula.
- Mark as New
- Bookmark
- Subscribe
- Mute
- Subscribe to RSS Feed
- Permalink
- Report Inappropriate Content
Ok, I'll put a Qlik Sense version on my todo list. For now you'll have to make do with the attached image.
talk is cheap, supply exceeds demand
- Mark as New
- Bookmark
- Subscribe
- Mute
- Subscribe to RSS Feed
- Permalink
- Report Inappropriate Content
Try the below
=
Count({<LapseTransactionMonth = p(CurrentMonth)} Distinct UserID)
-
Count({<LapseTransactionMonth = p(CurrentMonth), TransactionMonth = {"=(CurrentMonth)"} >} Distinct UserID)
If a post helps to resolve your issue, please accept it as a Solution.
- Mark as New
- Bookmark
- Subscribe
- Mute
- Subscribe to RSS Feed
- Permalink
- Report Inappropriate Content
Thanks Vineeth. I tried something similar, but the problem is that I don't know how to reference "CurrentMonth".
The chart I'm working on has TransactionMonth as the Dimension. The formula I'd like to build should use the dimension value itself.
So for July 2016, I'm trying to get a count of people who did a transaction in June 2016 but not in July. And looking at June 2016 I'd like to see how many did nothing in June but have done something in May, etc.
Basically, I'm trying to find a way of having the comparison not be against a single value for the whole visualisation, but instead consider each value in the dimension.
- Mark as New
- Bookmark
- Subscribe
- Mute
- Subscribe to RSS Feed
- Permalink
- Report Inappropriate Content
Dankjewel, Gysbert!
Also, I've looked at your solution and I think the problem I've got is that I don't have a scenario where I'd be comparing values from the same row.
Staying with your order scenario, let's say there were 2 customers with an order each last month (i.e. 2 order rows) and only one customer placed another order this month (another order-row).
I'd like the customer that didn't do anything this month to get counted.
This logic should then ideally be applied from the perspective of the other months and then get shown in the chart together - so that each value of the month-dimension shows how many customers stopped doing business in that month.
- Mark as New
- Bookmark
- Subscribe
- Mute
- Subscribe to RSS Feed
- Permalink
- Report Inappropriate Content
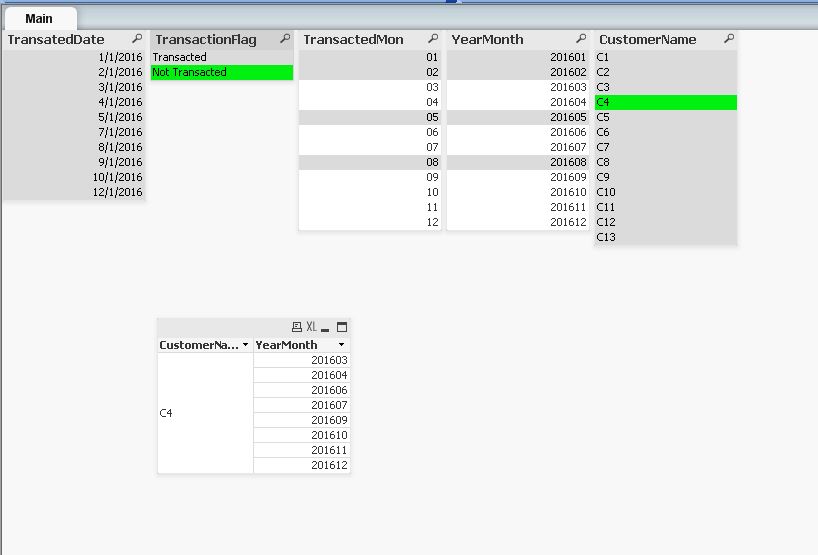
Hi ,
Please see attached QVW.
I've flagged transactions for each customer for each month, hope it helps.
If a post helps to resolve your issue, please accept it as a Solution.
- Mark as New
- Bookmark
- Subscribe
- Mute
- Subscribe to RSS Feed
- Permalink
- Report Inappropriate Content
Hi Sven,
Attaching a sample aggregated by yearmonth.
Cheers
V
If a post helps to resolve your issue, please accept it as a Solution.
- Mark as New
- Bookmark
- Subscribe
- Mute
- Subscribe to RSS Feed
- Permalink
- Report Inappropriate Content
Hi sven.skottke
Have you found a solution?can you share?
Thanks
Vineeth
If a post helps to resolve your issue, please accept it as a Solution.
- « Previous Replies
-
- 1
- 2
- Next Replies »