Unlock a world of possibilities! Login now and discover the exclusive benefits awaiting you.
- Qlik Community
- :
- Forums
- :
- Analytics
- :
- New to Qlik Analytics
- :
- Re: How can I show Week over Week analysis for two...
- Subscribe to RSS Feed
- Mark Topic as New
- Mark Topic as Read
- Float this Topic for Current User
- Bookmark
- Subscribe
- Mute
- Printer Friendly Page
- Mark as New
- Bookmark
- Subscribe
- Mute
- Subscribe to RSS Feed
- Permalink
- Report Inappropriate Content
How can I show Week over Week analysis for two years
Hi
I have a WoW analysis of the number of requests
My dimension is:
createdAt_u0.autoCalendar.Week
My measure is
Request # count
The chart looks okay in 2017, but in 2018 I have a problem as the chart looks like this:
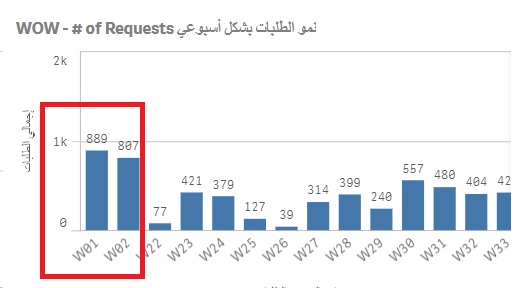
What do I want?
I want the two weeks of 2018 to be at the end of the chart not at the first
If someone can help, I'll appreciate that
- Mark as New
- Bookmark
- Subscribe
- Mute
- Subscribe to RSS Feed
- Permalink
- Report Inappropriate Content
For a dimension you will have to use a combination of year and month which would be the field:
createdAt_u0.autoCalendar.YearWeek
- Mark as New
- Bookmark
- Subscribe
- Mute
- Subscribe to RSS Feed
- Permalink
- Report Inappropriate Content
Hi Petter and thanks for the response
Unfortunately, I don't have that dimension yet, can you help me out on how to create it in the script?
I tried this but it didn't work out
- Mark as New
- Bookmark
- Subscribe
- Mute
- Subscribe to RSS Feed
- Permalink
- Report Inappropriate Content
Hi,
you can try to add like below,
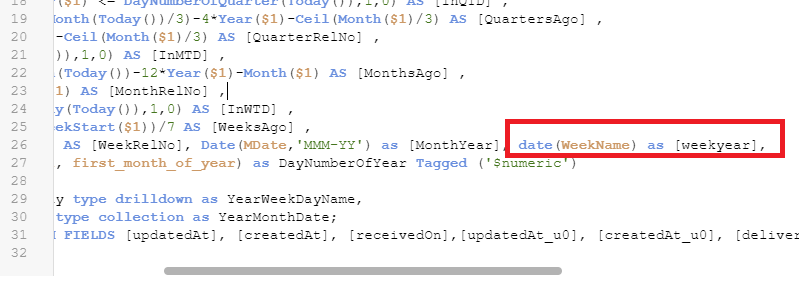
Week(weekstart(CalDate)) & '-' & WeekYear(CalDate) as WeekYear,
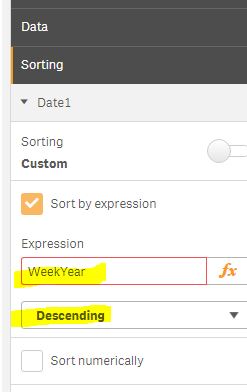
after adding this field try to add in your chart - sort table expression WeekYear as ascending order and u can get the desired result
Note: remember to update your Date field instead of CalDate.
Thanks
Deva
- Mark as New
- Bookmark
- Subscribe
- Mute
- Subscribe to RSS Feed
- Permalink
- Report Inappropriate Content
It worked and gave me the results but it shows weeks from right to left
Is there any way I can make the weeks from left to right?
Thanks a lot!
- Mark as New
- Bookmark
- Subscribe
- Mute
- Subscribe to RSS Feed
- Permalink
- Report Inappropriate Content
Hi,
so just want the latest WeekYear to be in the left side and history week display in right side right? then u try to change the Sort order as descending
- Mark as New
- Bookmark
- Subscribe
- Mute
- Subscribe to RSS Feed
- Permalink
- Report Inappropriate Content
WeekYear($1)&Num(Week($1),'00')
Give you the right order in an autocalender if you have
Set BrokenWeeks=0;