Unlock a world of possibilities! Login now and discover the exclusive benefits awaiting you.
- Qlik Community
- :
- Forums
- :
- Analytics
- :
- New to Qlik Analytics
- :
- Re: How can i change colors in a chart?
- Subscribe to RSS Feed
- Mark Topic as New
- Mark Topic as Read
- Float this Topic for Current User
- Bookmark
- Subscribe
- Mute
- Printer Friendly Page
- Mark as New
- Bookmark
- Subscribe
- Mute
- Subscribe to RSS Feed
- Permalink
- Report Inappropriate Content
How can i change colors in a chart?
Hi,
how can i change colors in a chart? I want to change each line in a special color. But if i click on the color in the property field nothing happened.
Regards,
Fritz
- Mark as New
- Bookmark
- Subscribe
- Mute
- Subscribe to RSS Feed
- Permalink
- Report Inappropriate Content
Hi Fritz,
You have the options in properties panel to colour by dim mention if you turn on the custom colour toggle button. you can even colour lines by using an expression:
Refer to the thread:
Line charts with dynamic / filterable measures
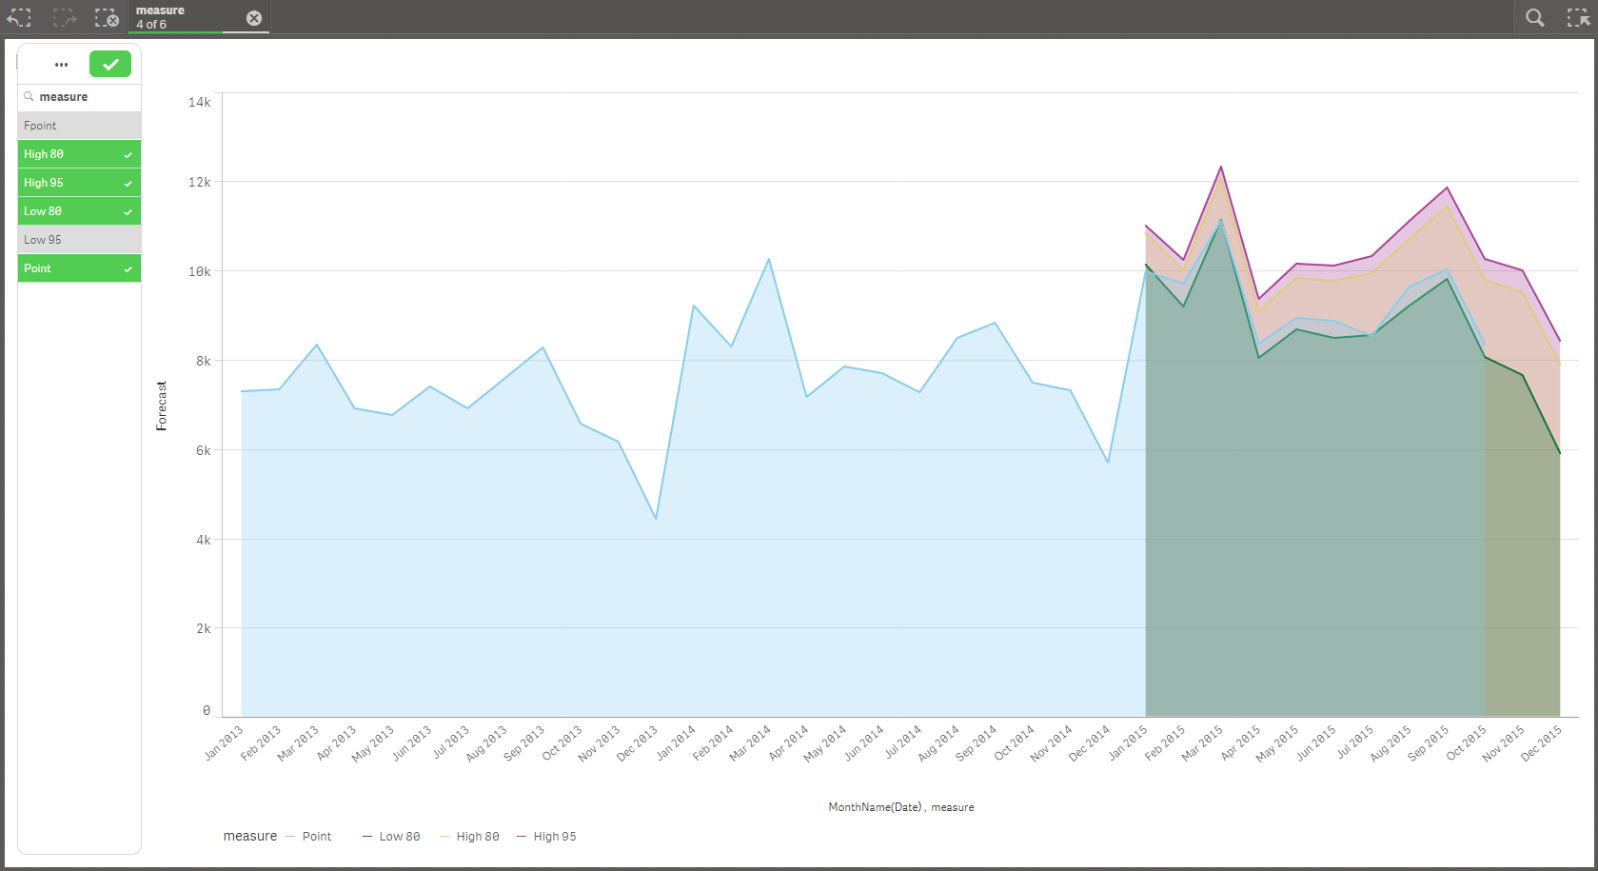
There is Sample QVF attached as well in the thread.
Thanks and Regards,
Sangram Reddy.
- Mark as New
- Bookmark
- Subscribe
- Mute
- Subscribe to RSS Feed
- Permalink
- Report Inappropriate Content
Hi Sangram,
thank you,
Is there an easier way like
set measurename1 = green()
set measurename2 = red()
set measurename3 = blue()
regards,
Fritz
- Mark as New
- Bookmark
- Subscribe
- Mute
- Subscribe to RSS Feed
- Permalink
- Report Inappropriate Content
Hi Fritz,
You can do it this way:
You will have to add an extra dimension to the line chart which has the names of your measure. Once done make use of the below expression to colour your chart:
if(<Dim2> = 'measurename1',green(),
if(<Dim2> = 'measurename2',red(),blue()
))
Thanks,
Sangram
- Mark as New
- Bookmark
- Subscribe
- Mute
- Subscribe to RSS Feed
- Permalink
- Report Inappropriate Content
Hi Sangram,
i can add only 1 dimension to the line chart.
regards,
Fritz
- Mark as New
- Bookmark
- Subscribe
- Mute
- Subscribe to RSS Feed
- Permalink
- Report Inappropriate Content
Hi Fritz,
you will be able to add 2 dimensions if you have only one measure to display. if you need multiple measures with 2 dimensions, you need to follow the procedure I have mentioned earlier.
Thanks,
Sangram.
- Mark as New
- Bookmark
- Subscribe
- Mute
- Subscribe to RSS Feed
- Permalink
- Report Inappropriate Content
Hi Sangram,
i have one linechart with one dimension
- month
and 2 measures
- count(sales)
- sum(sales)
I can´t add a second dimension to the chart. It´s only possible to replace the existing dimension.
regrads,
Fritz
- Mark as New
- Bookmark
- Subscribe
- Mute
- Subscribe to RSS Feed
- Permalink
- Report Inappropriate Content
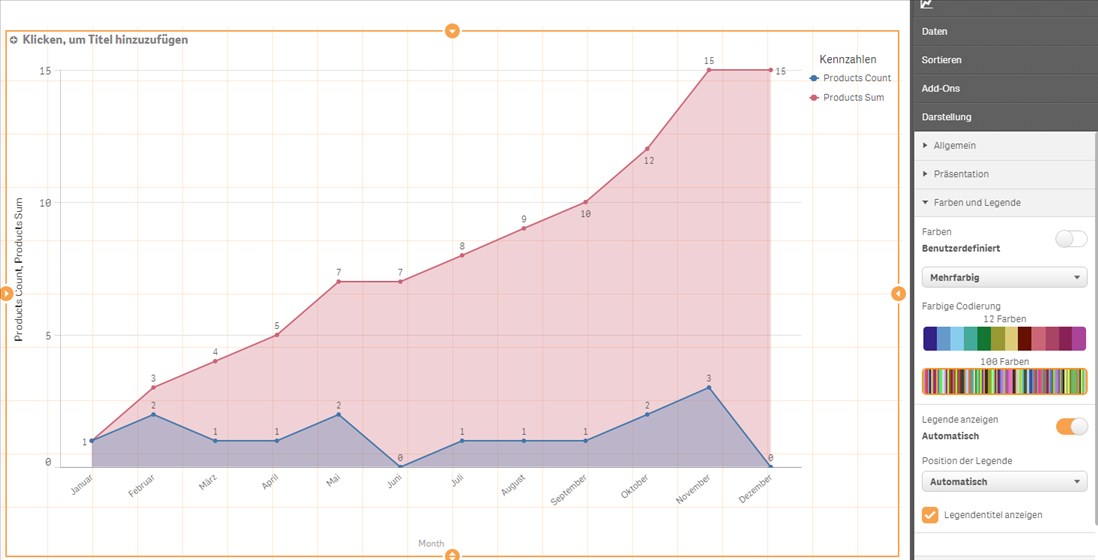
Hi Fritz,
You can still achieve this:
Add an inline table:
[Measures]:
load * inline [
Measure
Count
Sum
];
Now in a line chart add 2 dimensions: Month, Measure
Add a measure with the expression:
if(Measure = 'Count',count(sales), if(Measure = 'Sum',sum(sales)))
Colour Expression: if(Measure = 'Count',Green(), if(Measure = 'Sum',blue()))
Just follow this and you should be able ot solve your issue.
Thanks,
Sangram
- Mark as New
- Bookmark
- Subscribe
- Mute
- Subscribe to RSS Feed
- Permalink
- Report Inappropriate Content
Hi Fritz,
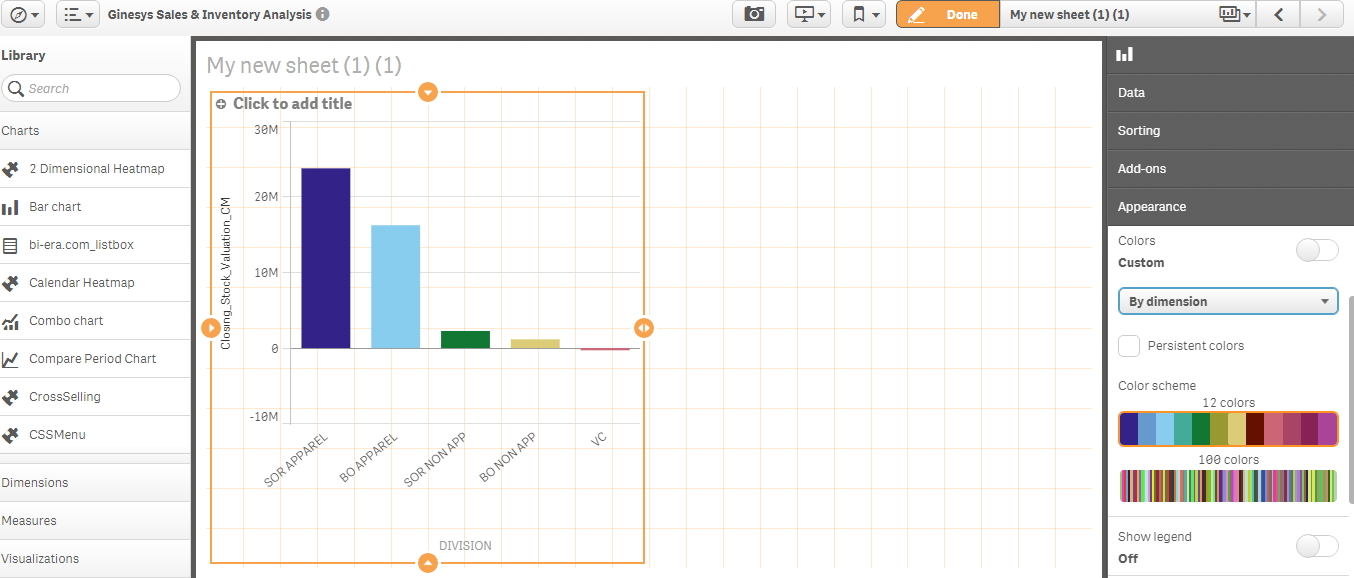
To change color of bar chart based on dimensions or measures.
For change the color with respect to measures:
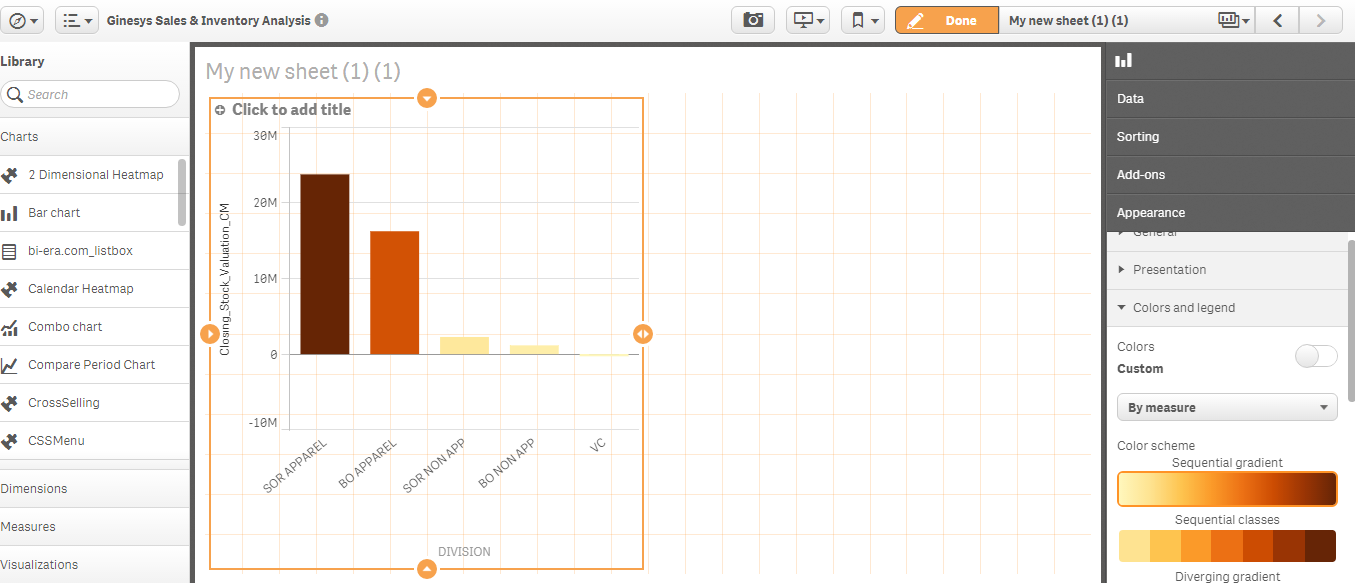
For Change the color with respect to dimensions:
Susovan