Unlock a world of possibilities! Login now and discover the exclusive benefits awaiting you.
- Qlik Community
- :
- Forums
- :
- Analytics
- :
- New to Qlik Analytics
- :
- How can we pick color for measure of line chart fo...
- Subscribe to RSS Feed
- Mark Topic as New
- Mark Topic as Read
- Float this Topic for Current User
- Bookmark
- Subscribe
- Mute
- Printer Friendly Page
- Mark as New
- Bookmark
- Subscribe
- Mute
- Subscribe to RSS Feed
- Permalink
- Report Inappropriate Content
How can we pick color for measure of line chart for each line??
Hi Experts,
I have line chart with 3 line of measures, i want to pick my custom color "by measures" but its showing option as color scheme gradient and classes option (see in image).. iI want to choose specific color(not gradient style) for each line in property. please help...
- Tags:
- color
- Subscribe by Topic:
-
Color by measures value in qliksense
-
General Question
-
measures
- Mark as New
- Bookmark
- Subscribe
- Mute
- Subscribe to RSS Feed
- Permalink
- Report Inappropriate Content
Hi Sahaj,
You can do this my making a master measure.
- Master Items
- Measures
- Create
- Create new measure
- Segment colors (here you define the colors)
If you have a dimension that is creating your 3 lines, you can do the same but then for dimensions.
Jordy
Climber
- Mark as New
- Bookmark
- Subscribe
- Mute
- Subscribe to RSS Feed
- Permalink
- Report Inappropriate Content
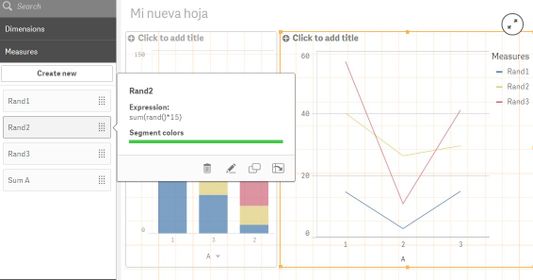
@JordyWegman , thanks for information. I have tried to change in using master item in segment. I have choose RGB for Rand 1 , Rand 2 and Rand 3. but in line chart showing different color... if i choose rand 3, by measure in property then it showing all line showing green.. please check below.
.
- Mark as New
- Bookmark
- Subscribe
- Mute
- Subscribe to RSS Feed
- Permalink
- Report Inappropriate Content
Hi,
That last one is because you use one measure with one dimension that has three values.
Check my example:
I have made a master measure, named it Name 2 and color green. I added this in the graph in the back as a measure and it becomes green! Same for the yellow one. Can you reproduce this?
Jordy
Climber


