Unlock a world of possibilities! Login now and discover the exclusive benefits awaiting you.
- Qlik Community
- :
- Forums
- :
- Analytics
- :
- New to Qlik Analytics
- :
- Re: How do create relative measure in Qlik Sense?
- Subscribe to RSS Feed
- Mark Topic as New
- Mark Topic as Read
- Float this Topic for Current User
- Bookmark
- Subscribe
- Mute
- Printer Friendly Page
- Mark as New
- Bookmark
- Subscribe
- Mute
- Subscribe to RSS Feed
- Permalink
- Report Inappropriate Content
How do create relative measure in Qlik Sense?
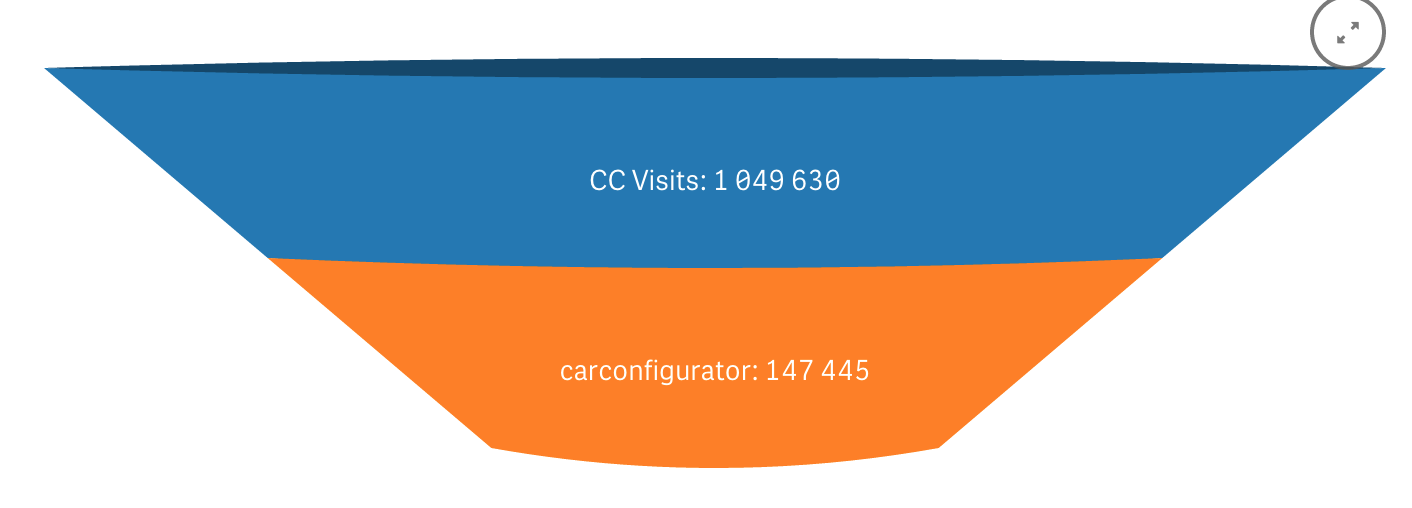
What I have is dimension called Funnel Steps (steps in conversion funnel) and measure Funnel Amount (conversions in each step). If I use a funnel chart then I get a funnel with measures of number values. I also need relative measure in precentage (conversion rate) of how many users converted from each step to the next. So in this simple example I would also like to see precentage of how many CC Visits converted into carconfigurator usage.
How can one define such measure?
- Mark as New
- Bookmark
- Subscribe
- Mute
- Subscribe to RSS Feed
- Permalink
- Report Inappropriate Content
I take it you are using the nice funnel chart extension.
I don't think you can show the relative measure in this chart as it can support only one dimension and one measure.
What I would recommend is you use a separate KPI Visualisation to show your conversion rate as a % you could set a target against it and have it go green or red dependent on achievement.
Hope this helps
Regards
Andy
- Mark as New
- Bookmark
- Subscribe
- Mute
- Subscribe to RSS Feed
- Permalink
- Report Inappropriate Content
Probably You are right and it can't be visualized on the same chart but question still remains how to create a measure in Qlik Sense?
I tried to use such expression when creating measure if(wildmatch([Funnel Step],'carconfigurator'),sum([Funnel Amount])) / if(wildmatch([Funnel Step],'CC Visits'),sum([Funnel Amount])) This doesn't work. Is it even possible to sum values in one column depending on values in another? It seems so basic to me and sumif does it in Excel. How can it be done in Sense, in particular how to create measure in such way?
Regards
Meelis
- Mark as New
- Bookmark
- Subscribe
- Mute
- Subscribe to RSS Feed
- Permalink
- Report Inappropriate Content
Hi,
Try like this
=Sum(MeasureName)/Sum(TOTAL MeasureName)
Note: Replace MeasureName with your actual field name.
Regards,
jagan.
- Mark as New
- Bookmark
- Subscribe
- Mute
- Subscribe to RSS Feed
- Permalink
- Report Inappropriate Content
for your KPI a measure
SUM({<[Funnel Step]={''CC Visits''}>} [Funnel Amount])/SUM({<[Funnel Step]={'carconfigurator'}>} [Funnel Amount])
should give you % of visits.
Regards
Andy