Unlock a world of possibilities! Login now and discover the exclusive benefits awaiting you.
- Qlik Community
- :
- Forums
- :
- Analytics
- :
- New to Qlik Analytics
- :
- Re: How let I start a combo chart from zero?
Options
- Subscribe to RSS Feed
- Mark Topic as New
- Mark Topic as Read
- Float this Topic for Current User
- Bookmark
- Subscribe
- Mute
- Printer Friendly Page
Turn on suggestions
Auto-suggest helps you quickly narrow down your search results by suggesting possible matches as you type.
Showing results for
Anonymous
Not applicable
2017-12-29
05:04 AM
- Mark as New
- Bookmark
- Subscribe
- Mute
- Subscribe to RSS Feed
- Permalink
- Report Inappropriate Content
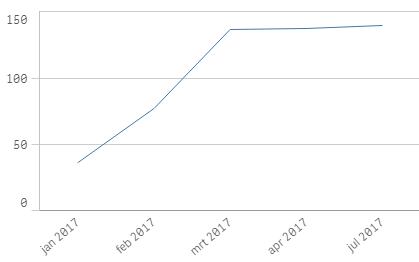
How let I start a combo chart from zero?
Hi all,
I made a combo chart which plots several points(see image), however I want this chart to always start at zero.
How can I make this happen?
648 Views
3 Replies
MVP
2017-12-29
11:33 AM
- Mark as New
- Bookmark
- Subscribe
- Mute
- Subscribe to RSS Feed
- Permalink
- Report Inappropriate Content
Would you be able to share a sample to look at this?
389 Views
Anonymous
Not applicable
2017-12-29
11:43 AM
Author
- Mark as New
- Bookmark
- Subscribe
- Mute
- Subscribe to RSS Feed
- Permalink
- Report Inappropriate Content
In the Properties Panel, Appearance | Y-Axis: YourMeasure
- Set Range to Custom
- Then below set to Min
- Enter 0 for Min
Partner - Master
2017-12-29
11:55 AM
- Mark as New
- Bookmark
- Subscribe
- Mute
- Subscribe to RSS Feed
- Permalink
- Report Inappropriate Content
I'm not sure about your request.
For example datas:
Jan 2017 30
Feb 2017 70
Mar 2017 100
So you want to see:
Jan 2017 0
Feb 2017 40 (70-30)
Mar 2017 70 (100-70)
Am I right?
So set your Expression to
sum(value) - top(sum(value))
Regards
389 Views
Community Browser