Unlock a world of possibilities! Login now and discover the exclusive benefits awaiting you.
- Qlik Community
- :
- Forums
- :
- Analytics
- :
- New to Qlik Analytics
- :
- How to Calculate 80th percentile and translate it ...
- Subscribe to RSS Feed
- Mark Topic as New
- Mark Topic as Read
- Float this Topic for Current User
- Bookmark
- Subscribe
- Mute
- Printer Friendly Page
- Mark as New
- Bookmark
- Subscribe
- Mute
- Subscribe to RSS Feed
- Permalink
- Report Inappropriate Content
How to Calculate 80th percentile and translate it to Bar Chart
Hi need some help,
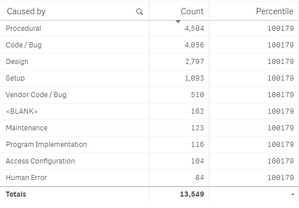
I'm trying to calculate and display 80th percentile with my bar chart below.
I've attached the dummy data
Been trying to use to figure out how to do a 80 20 rule against count with Fractile(), however haven't seem to figure out how to get it to work.
fractile(Count (Total [ID])), .8)
So my End Result I wish to Achieve something like this.
- Tags:
- bar chart
- Subscribe by Topic:
-
bar chart expressions
-
expression by color
-
Percentile
-
Set Analysis
- Mark as New
- Bookmark
- Subscribe
- Mute
- Subscribe to RSS Feed
- Permalink
- Report Inappropriate Content
Hi there
I haven't done it before, but I can see that it might become a business request in future so I decided to look around. Try something this:
https://community.qlik.com/t5/Qlik-Design-Blog/Recipe-for-a-Pareto-Analysis/ba-p/1468497
I know it is in QlikView, but the principles stay the same.
Regards,
Mauritz
- Mark as New
- Bookmark
- Subscribe
- Mute
- Subscribe to RSS Feed
- Permalink
- Report Inappropriate Content
Hi,
An example app with Pareto colouring in a barchart and Pareto colouring in a combochart is attached;
Best Regards
Lucke
- Mark as New
- Bookmark
- Subscribe
- Mute
- Subscribe to RSS Feed
- Permalink
- Report Inappropriate Content
You might want to have a look at this article as well;
https://community.qlik.com/t5/Qlik-Design-Blog/Recipe-for-a-Pareto-Analysis-Revisited/ba-p/1473684


