Unlock a world of possibilities! Login now and discover the exclusive benefits awaiting you.
- Qlik Community
- :
- Forums
- :
- Analytics
- :
- New to Qlik Analytics
- :
- Re: How to Create Pie Chart With two measures in Q...
- Subscribe to RSS Feed
- Mark Topic as New
- Mark Topic as Read
- Float this Topic for Current User
- Bookmark
- Subscribe
- Mute
- Printer Friendly Page
- Mark as New
- Bookmark
- Subscribe
- Mute
- Subscribe to RSS Feed
- Permalink
- Report Inappropriate Content
How to Create Pie Chart With two measures in Qlik Sense
Hi Guys,
I have a requirement, I want to create pie char/ donut chart with two measures below i am mentioning my dimensions & measures
Dimension: Skill Name
Expression1: =Sum({<[Closed date] = {"$(='>=' & Date(Today()-30))"},[Job Status]={Closed}>} [Total No. of Openings])
Expression2: ==Sum({<[Closed date] = {"$(='>=' & Date(Today()-30))"},[Job Status]={Closed}>} [Ageing in days])
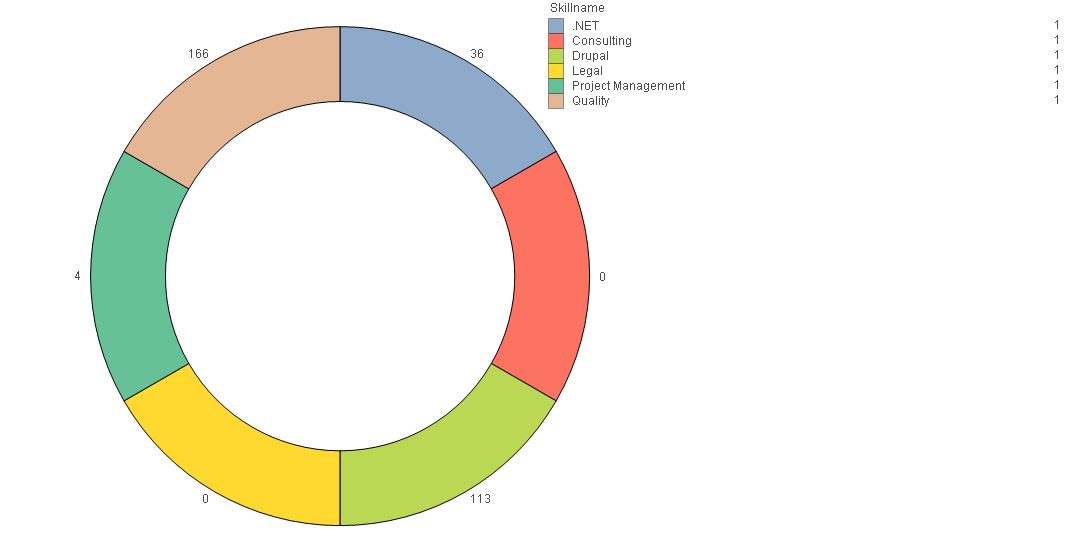
I want my chart like this.. this chart i created in qlikview
I legend i have mentioned dimension and Expression1 and in chart Expression2 values are visibling
Can you guys Please help me out from this
Thank you in advance
Regards,
B V S Sudhakar
- Mark as New
- Bookmark
- Subscribe
- Mute
- Subscribe to RSS Feed
- Permalink
- Report Inappropriate Content
Yes you can do it in Qlik Sense too - but it has to be done in an entirely different way as you can't have more than one measure. However this single measure can use the Dual() to concatenate several expressions into a string part while providing only the original measure into the numeric part of the Dual().

In addition you will have to set the measure's "Number formatting" to "Measure expression" and then under "Appearance", "Presentation" switch the "Value Labels" to "Custom" and select "Values".
- Mark as New
- Bookmark
- Subscribe
- Mute
- Subscribe to RSS Feed
- Permalink
- Report Inappropriate Content
Hi,
I tried with Dual Expression:
dual(Sum({<[Closed date] = {"$(='>=' & Date(Today()-30))"},[Job Status]={Closed}>} [Total No. of Openings]),Sum({<[Closed date] = {"$(='>=' & Date(Today()-30))"},[Job Status]={Closed}>} [Ageing in days]))
I got the chart like this:
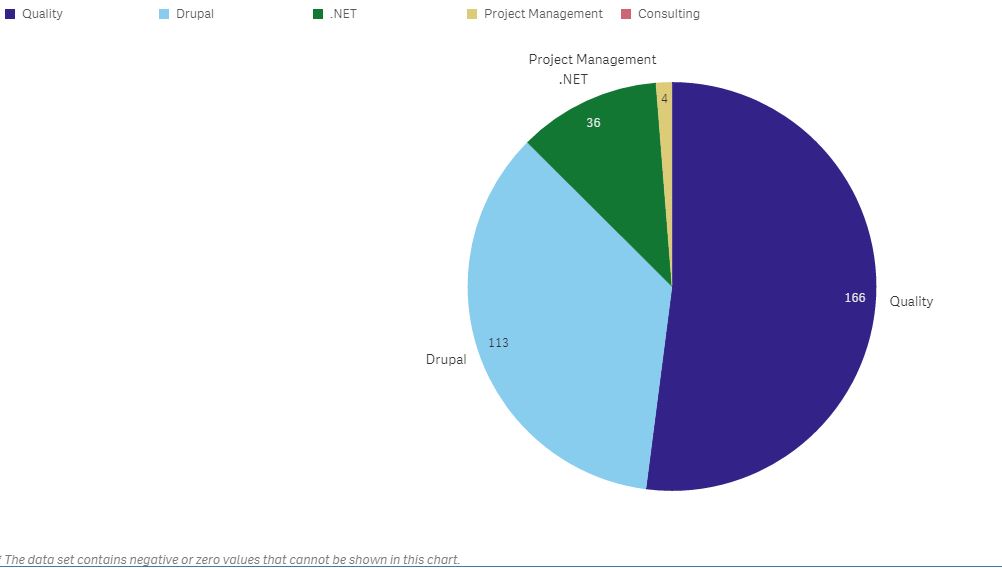
But i want one change, I want no.of openings values in legend (Eg: Quality 1, Drupal 4, .NET 2.... like this).
In chart i have show Ageing days but in legend i want openings values.
And
Is there any Possibility to show null/zero values in this chart
- Mark as New
- Bookmark
- Subscribe
- Mute
- Subscribe to RSS Feed
- Permalink
- Report Inappropriate Content
priyalvp24mbaeyensmanoj217rwunderlichpetter-s
Hey Guys Please help me out from this also