Unlock a world of possibilities! Login now and discover the exclusive benefits awaiting you.
- Qlik Community
- :
- Forums
- :
- Analytics
- :
- New to Qlik Analytics
- :
- Re: How to Give Background color based on the Valu...
- Subscribe to RSS Feed
- Mark Topic as New
- Mark Topic as Read
- Float this Topic for Current User
- Bookmark
- Subscribe
- Mute
- Printer Friendly Page
- Mark as New
- Bookmark
- Subscribe
- Mute
- Subscribe to RSS Feed
- Permalink
- Report Inappropriate Content
How to Give Background color based on the Value
Hi All
I Created a Cohort Chart in qliksense. for that i used as Pivot Table to achieve this.
But i want to give color to the Background based on the values.
As check Vertical Value and give dark green color to Highest Value than medium number in Yellow Color and lowest number in
Red Color .
Kindly Check the Attachement . that will show you how i am Looking for.
my exp : Count(Distinct VID)
- Mark as New
- Bookmark
- Subscribe
- Mute
- Subscribe to RSS Feed
- Permalink
- Report Inappropriate Content
Would you be able to share your application?
- Mark as New
- Bookmark
- Subscribe
- Mute
- Subscribe to RSS Feed
- Permalink
- Report Inappropriate Content
Hi,
You can try in "VISUAL CLUES" tab , available in CHART properties .. It is very easy.
- Mark as New
- Bookmark
- Subscribe
- Mute
- Subscribe to RSS Feed
- Permalink
- Report Inappropriate Content
Is that available in Qlik Sense as well?
- Mark as New
- Bookmark
- Subscribe
- Mute
- Subscribe to RSS Feed
- Permalink
- Report Inappropriate Content
I think so No..
- Mark as New
- Bookmark
- Subscribe
- Mute
- Subscribe to RSS Feed
- Permalink
- Report Inappropriate Content
Hello,
yes it is possible with a if clause set in the Measure by background color by expression
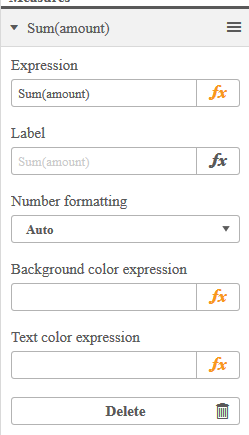
if(myvalue>minimum and myvalue< maxofminimum, red(),if(myvalue>middle and myvalue<middlemax,yellow(),if(myvalue>minofmax,green())))