Unlock a world of possibilities! Login now and discover the exclusive benefits awaiting you.
- Qlik Community
- :
- Forums
- :
- Analytics
- :
- New to Qlik Analytics
- :
- Re: How to add a value for the difference to a pre...
- Subscribe to RSS Feed
- Mark Topic as New
- Mark Topic as Read
- Float this Topic for Current User
- Bookmark
- Subscribe
- Mute
- Printer Friendly Page
- Mark as New
- Bookmark
- Subscribe
- Mute
- Subscribe to RSS Feed
- Permalink
- Report Inappropriate Content
How to add a value for the difference to a previous time period to a bar chart?
Hi, I'm using "Time" as a drilldown dimension consisting of the table fields "Year", "Month" and "Day". I have successfully created a bar chart that shows the measure "Sales" over the dimension "Time" and I am able to drill down in this chart to show the sales amont for all months of a selected year and all days of a selected month.
Now I want to add the difference in sales between the previous time period and the current time period as a measure to the chart. When no selection is made, it should show the difference between the years, when a year is selected, it should show the difference between the months of the year and when a month is selected it should show the difference between the days of the month.
How can I create a measure that shows the difference of the sales amount between the actual and the previous time period?
Accepted Solutions
- Mark as New
- Bookmark
- Subscribe
- Mute
- Subscribe to RSS Feed
- Permalink
- Report Inappropriate Content
Hi wolfgand
try this
dim = Time
mesure = sum(Sales)
mesure 2 = sum(Sales)- above(sum(Sales)
you may have somthing like that :
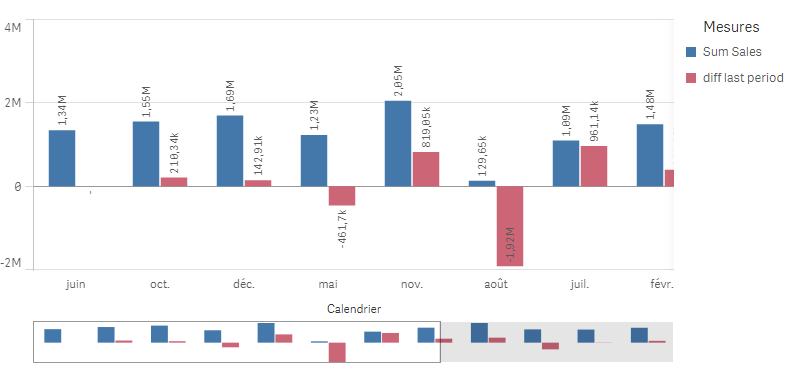
hope it helps
Bruno
- Mark as New
- Bookmark
- Subscribe
- Mute
- Subscribe to RSS Feed
- Permalink
- Report Inappropriate Content
Hi wolfgand
try this
dim = Time
mesure = sum(Sales)
mesure 2 = sum(Sales)- above(sum(Sales)
you may have somthing like that :
hope it helps
Bruno
- Mark as New
- Bookmark
- Subscribe
- Mute
- Subscribe to RSS Feed
- Permalink
- Report Inappropriate Content
Hi Bruno,
thank you very much, it worked!