Unlock a world of possibilities! Login now and discover the exclusive benefits awaiting you.
- Qlik Community
- :
- Forums
- :
- Analytics
- :
- New to Qlik Analytics
- :
- Re: How to add lineal trend in Qlik sense
- Subscribe to RSS Feed
- Mark Topic as New
- Mark Topic as Read
- Float this Topic for Current User
- Bookmark
- Subscribe
- Mute
- Printer Friendly Page
- Mark as New
- Bookmark
- Subscribe
- Mute
- Subscribe to RSS Feed
- Permalink
- Report Inappropriate Content
How to add lineal trend in Qlik sense
I would like to know how to add a lineal trend in a graph in Qlik Sense. Or an average trend also.
Thank you.
- Mark as New
- Bookmark
- Subscribe
- Mute
- Subscribe to RSS Feed
- Permalink
- Report Inappropriate Content
This solution works great. Can you help me understand the need for the IF statements in the expression?
- Mark as New
- Bookmark
- Subscribe
- Mute
- Subscribe to RSS Feed
- Permalink
- Report Inappropriate Content
I believe this may be due to the ONLY function which only returns a value if there "is one and only one possible result from the aggregated data" (Qlik Help). Otherwise, ONLY will return Null. Perhaps using the AGGR function on a year-month (Dec-2016,Jan-2017,Feb-2017) field would do the trick? I use a year-month type format and it works for me.
- Mark as New
- Bookmark
- Subscribe
- Mute
- Subscribe to RSS Feed
- Permalink
- Report Inappropriate Content
Hey there,
This has been really helpful. although if I'm honest I'm not sure I understand how it works.
I have gotten the formula at the top to work in my chart however I am trying to get a straight diagonal trendline and wondering if there is a way I can modify this formula to do that? I've included my formula below:
linest_m(total aggr(if(sum(DOTs),sum(DOTs)),[%Date_ID]),[%Date_ID])
*
[%Date_ID]
+
linest_b(total aggr (if(sum(DOTs),sum(DOTs)),[%Date_ID]),[%Date_ID])
As you can probably determine, I am trying to show a trendline for DOTs over the period of time. Any insight would be greatly appreciated.
- Mark as New
- Bookmark
- Subscribe
- Mute
- Subscribe to RSS Feed
- Permalink
- Report Inappropriate Content
Thank you - that's a great solution.
Without date filter it does work properly in our environment. Unfortunately, if I want to put a filter on the date for the other elements on the dashboard the linear trend line doesn't work anymore (Qlik Sense June 2018 Server 12.26.1).
So I tried to add a filter exclusion {<OrderDate=>}:
linest_m(total aggr(if(sum({<OrderDate=>}Sales),sum({<OrderDate=>}Sales)),OrderDate),OrderDate)*
only({1}OrderDate)+linest_b(total aggr(if(sum({<OrderDate=>}Sales),sum({<OrderDate=>}Sales)),OrderDate),OrderDate)
But this breaks the complete solution. Any Idea how to fix that?
- Mark as New
- Bookmark
- Subscribe
- Mute
- Subscribe to RSS Feed
- Permalink
- Report Inappropriate Content
Hi Johannes - let me take a look.
Regards,
Mike T
Qlik
Mike Tarallo
Qlik
- Mark as New
- Bookmark
- Subscribe
- Mute
- Subscribe to RSS Feed
- Permalink
- Report Inappropriate Content
Hi Johannes - with some help from a colleague I was able to get this to work for you - please replace the trend expression with this one:
linest_m({1} total aggr(if(sum({1} Sales),sum({1} Sales)),OrderDate),OrderDate)*only({1} OrderDate) +
linest_b({1} total aggr(if(sum({1} Sales),sum({1} Sales)),OrderDate),OrderDate)
This is using Set Analysis as you suspected where {1} is an identifier used to ignore selections.
For those that are interested:
https://help.qlik.com/en-US/qlikview/November2017/Subsystems/Client/Content/ChartFunctions/SetAnalys...
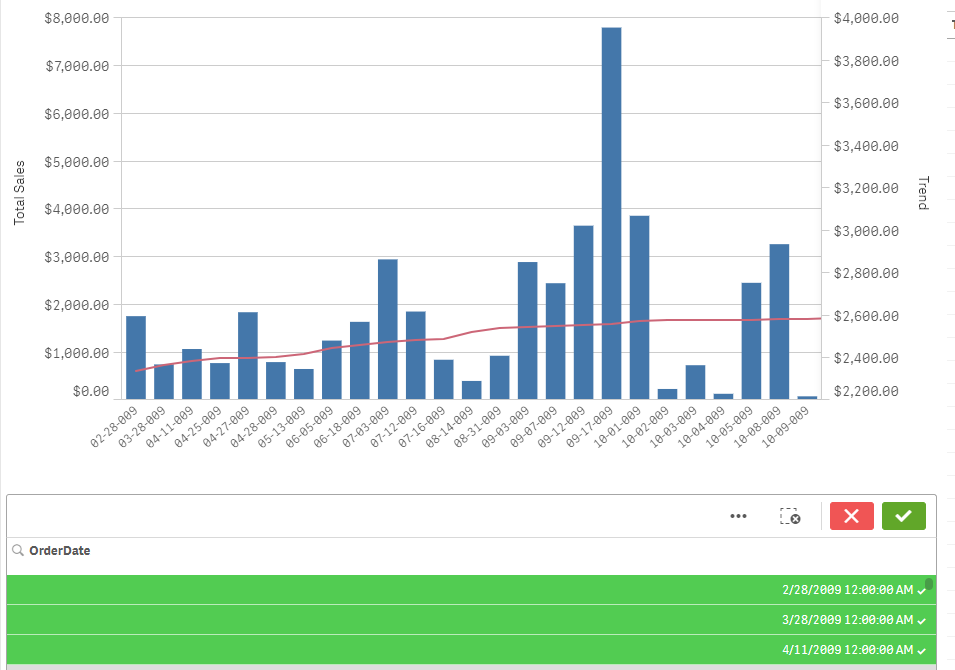
Not my sales figure for the bar is:
Sum({1<OrderDate=>}Sales)
It will ignore the data selection as you wanted:
I also attached a sample .qvf
Hope this helps
Regards,
Mike T
Qlik
Mike Tarallo
Qlik
- Mark as New
- Bookmark
- Subscribe
- Mute
- Subscribe to RSS Feed
- Permalink
- Report Inappropriate Content
Geez, I hate to be a buzzkill here, but, it seems to me that:
1. The request here is entirely reasonable, i.e., an -out-of-the-box trend line (linear, logarithmic, and exponential).
2. This thread came into existence over four years ago.
3. As far as I'm aware, Qlik Sense still has no such provision.
4. The solution that Mike Tarallo proposed, while better than nothing, obscures the fact that in a data-visualization tool, something like this should be (in my opinion) directly available.
5. I am disappointed. Is my attitude here unreasonable or off-base in any way? Does no one else share this disappointment? After all, it doesn't seem like this should be that difficult, especially in light of it being already available in Qlik View.
6. I like Qlik Sense, but I find the absence of this particular feature truly puzzling.
- Mark as New
- Bookmark
- Subscribe
- Mute
- Subscribe to RSS Feed
- Permalink
- Report Inappropriate Content
I agree to all of your points.
To me Qlik Sense seems to be at a stand still in regards to development of the product. In stead of buying companies Qlik should use the ressources to mature the Sense product. I appreciate that the acquisitions over time will refine the product but I fear that integrating the acquired software into the core product will overshadow the development of Sense.
I just don't understand how a product this old can seem so immature...
- Mark as New
- Bookmark
- Subscribe
- Mute
- Subscribe to RSS Feed
- Permalink
- Report Inappropriate Content
ABSOLUTELY
- Mark as New
- Bookmark
- Subscribe
- Mute
- Subscribe to RSS Feed
- Permalink
- Report Inappropriate Content
Hello.
I tried every combinations of with {1}, only({1} and without 1... in QLIKVIEW (APR 2020).
And It looks like... QLIKVIEW in charts for option Reference Line can draw only Vertical OR Horizontal lines according to ONE base coordinate. Is it so finally determined?
By the way, Mike ( @Michael_Tarallo ), on your picture there's one red curve line that you named 'linear trend line'. Is it feature or ideal bug? hmm)