Unlock a world of possibilities! Login now and discover the exclusive benefits awaiting you.
- Qlik Community
- :
- Forums
- :
- Analytics
- :
- New to Qlik Analytics
- :
- Re: How to choose which measure field to be displa...
- Subscribe to RSS Feed
- Mark Topic as New
- Mark Topic as Read
- Float this Topic for Current User
- Bookmark
- Subscribe
- Mute
- Printer Friendly Page
- Mark as New
- Bookmark
- Subscribe
- Mute
- Subscribe to RSS Feed
- Permalink
- Report Inappropriate Content
How to choose which measure field to be displayed in a table just like using a filter?
Hi all,
Thanks for taking your time to read this. I have a very simple table with month as my dimension and let's say, cost and quantity as my measures.
I'm trying to create a filter pane or something similar which allows me to control which measure field to be displayed (like a filter);i.e.: I may just want cost only at this instance and quantity at another instance but I'm not sure whether you can do that in Qlik Sense. If yes, can someone please suggest a simple way to do so? Thank you very much!
For your information, I definitely need to have my month as the dimension as that is my top priority filtering field.
- Mark as New
- Bookmark
- Subscribe
- Mute
- Subscribe to RSS Feed
- Permalink
- Report Inappropriate Content
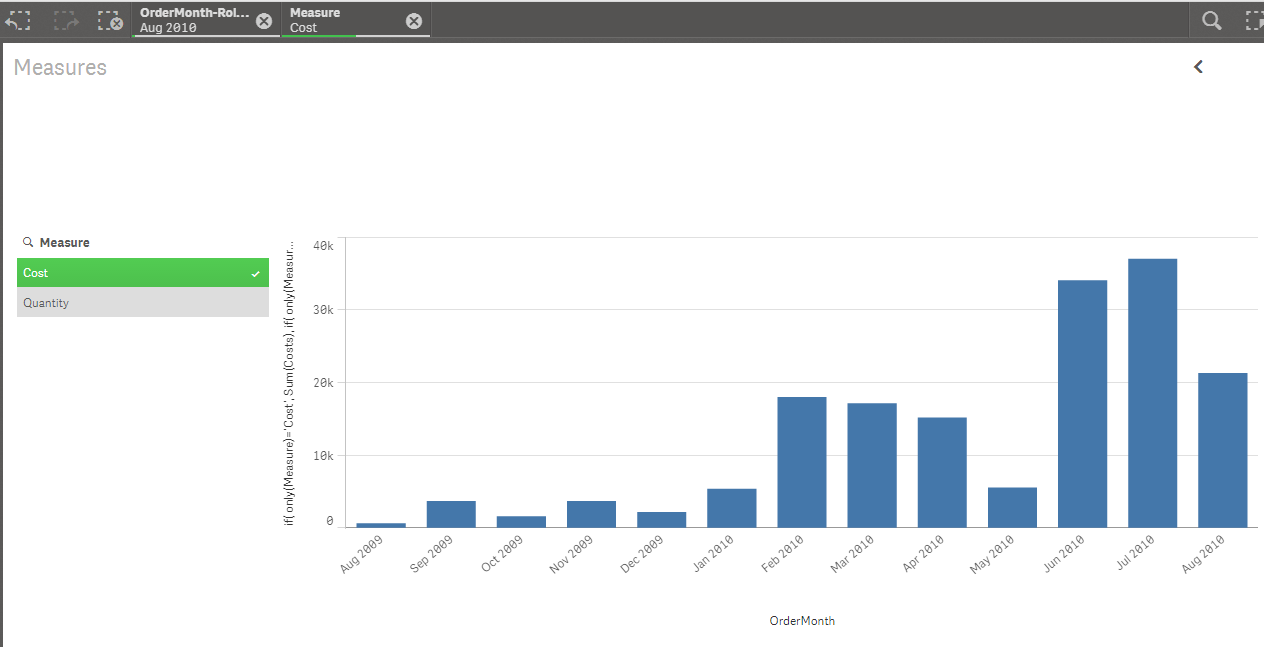
You can load an 'inline' table into Sense that stores both measures. The following code will work in the load editor to do this:
load * inline [
Measure
Cost
Quantity];
Then add 'Measure' as a filter pane . Add a bar chart with Month as the dimension and the following expression as your measure:
if( only(Measure)='Cost', Sum(Costs), if( only(Measure)='Quantity', Sum(Quantity)))
- Mark as New
- Bookmark
- Subscribe
- Mute
- Subscribe to RSS Feed
- Permalink
- Report Inappropriate Content
Another way is to use an $-expansion expression as measure:
// LOAD Script:
MetaData:
load * inline [
Measure, Formula
Cost, Sum(Cost)
Quantity, Sum(Quantity)
];
// in Chart Expression:
$(= [Formula])
Use the field Measure in a listbox as shown above.
I would prefer this way because in the if( ) construct above both Sum( ) aggregations will be executed always.
- Ralf
- Mark as New
- Bookmark
- Subscribe
- Mute
- Subscribe to RSS Feed
- Permalink
- Report Inappropriate Content
Thanks for the help guys - appreciate it.
However, I have some minor issues with that approach:
1) It seems like I can only have one selection measure to be displayed per instance; i.e. when I try to select both measures (Cost & Quantity), the graph becomes blank but when I select them separately, they are displaying the right values.
2) The above approach works with measures that have just one word. I tried it on a measure with two words such as 'EX GST' and it's not displaying any values at all.
3) Will the approach work on a table rather than a chart? E.g.: removing the column of a measure when the measure is not selected. I have a feeling that it doesn't.
Having said that, I'm glad that I've learned something new and really wanna thank you guys for the help.