Unlock a world of possibilities! Login now and discover the exclusive benefits awaiting you.
- Qlik Community
- :
- Forums
- :
- Analytics
- :
- New to Qlik Analytics
- :
- How to create a totals bars in Qlik Sense with Set...
- Subscribe to RSS Feed
- Mark Topic as New
- Mark Topic as Read
- Float this Topic for Current User
- Bookmark
- Subscribe
- Mute
- Printer Friendly Page
- Mark as New
- Bookmark
- Subscribe
- Mute
- Subscribe to RSS Feed
- Permalink
- Report Inappropriate Content
How to create a totals bars in Qlik Sense with Set Analysis?
I have a Bar chart with one dimension (Month) and three measures.
I would like to have the total for each measure at the end of the chart.
How can I achive it with set Analysis?
Accepted Solutions
- Mark as New
- Bookmark
- Subscribe
- Mute
- Subscribe to RSS Feed
- Permalink
- Report Inappropriate Content
Hi Diogo,
you can't do this by set analysis. The idea of set analysis is to modify data set which is taken into account for chart calculation. This means that the set analysis is evaluated before chart is calculated. During chart calculation the data is sliced by dimension values. As a result, you cannot add a new dimension value or "show data for previous month on a line for this month" using set analysis. You need different approach.
In your case I would try to create an as-of calendar table in script linking each month to itself plus a "Total" month, which will result in a new dimension containing 12 months plus a "Total" month. This dimension than can be used in your bar chart. You can read more about as-of calendar tables here: The As-Of Table
Best
Juraj
- Mark as New
- Bookmark
- Subscribe
- Mute
- Subscribe to RSS Feed
- Permalink
- Report Inappropriate Content
At the end of the chart?
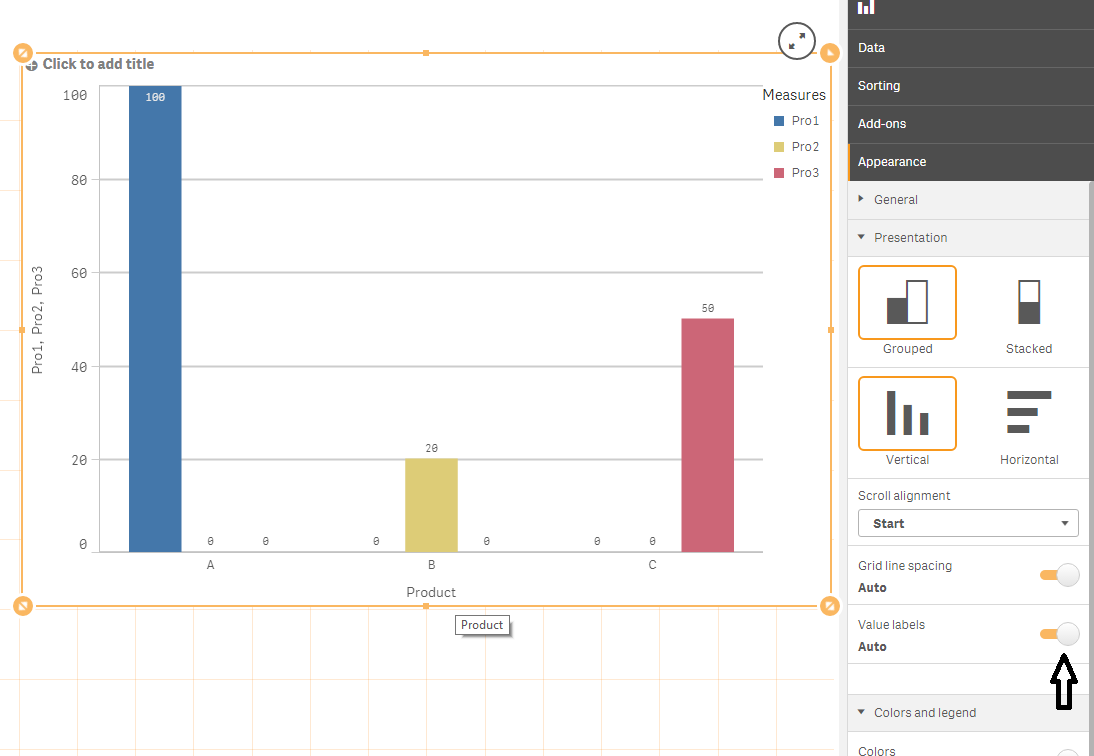
You can show totals on top of each bar (measure)
Whatever your expression is....in presentation tab for settings, enable Value Labels as auto.
- Mark as New
- Bookmark
- Subscribe
- Mute
- Subscribe to RSS Feed
- Permalink
- Report Inappropriate Content
Hi Diogo,
you can't do this by set analysis. The idea of set analysis is to modify data set which is taken into account for chart calculation. This means that the set analysis is evaluated before chart is calculated. During chart calculation the data is sliced by dimension values. As a result, you cannot add a new dimension value or "show data for previous month on a line for this month" using set analysis. You need different approach.
In your case I would try to create an as-of calendar table in script linking each month to itself plus a "Total" month, which will result in a new dimension containing 12 months plus a "Total" month. This dimension than can be used in your bar chart. You can read more about as-of calendar tables here: The As-Of Table
Best
Juraj
- Mark as New
- Bookmark
- Subscribe
- Mute
- Subscribe to RSS Feed
- Permalink
- Report Inappropriate Content
Hi Juraj,
Thank you for the reply,
This is exactly what I needed.
Best Regards