Unlock a world of possibilities! Login now and discover the exclusive benefits awaiting you.
- Qlik Community
- :
- Forums
- :
- Analytics
- :
- New to Qlik Analytics
- :
- How to do a histogram?
- Subscribe to RSS Feed
- Mark Topic as New
- Mark Topic as Read
- Float this Topic for Current User
- Bookmark
- Subscribe
- Mute
- Printer Friendly Page
- Mark as New
- Bookmark
- Subscribe
- Mute
- Subscribe to RSS Feed
- Permalink
- Report Inappropriate Content
How to do a histogram?
Hi everyone!
I am not used to use QlikVio. Actually, this techonolgy is new for me, but in the future I will use it more often. Could you give some help?
I am lost in the midle of so much information and I am still trying to figure out how to work with this program. Can you give me the steps how to do a simple histogram?
I have a Data with numbers from 0 to 20. I want to do a histogram which counts how many numbers are in specifics times periods, such as:
]0,1[
]1,2[
]2,3[
]3,6[
]6,10[
]10,20[. How can I do it? I tried to calculate an dimension using if and then do a count for the data but it doesnt work.
I will grateful if some one could help me out.
Thanks in advance,
Best,
Pedro Pereira
- « Previous Replies
- Next Replies »
- Mark as New
- Bookmark
- Subscribe
- Mute
- Subscribe to RSS Feed
- Permalink
- Report Inappropriate Content
Hi Pramod,
I'm not quite following your question. A histogram will produce a bell curve if the data happens to have a normal distribution. Could you please elaborate what your are looking for?
-Josh
Qlik
- Mark as New
- Bookmark
- Subscribe
- Mute
- Subscribe to RSS Feed
- Permalink
- Report Inappropriate Content
Hi josh,
I am attaching the sample data.
Please look it and explain how to create a bell curve for this data.
i need to display average time taken for each subject_id.
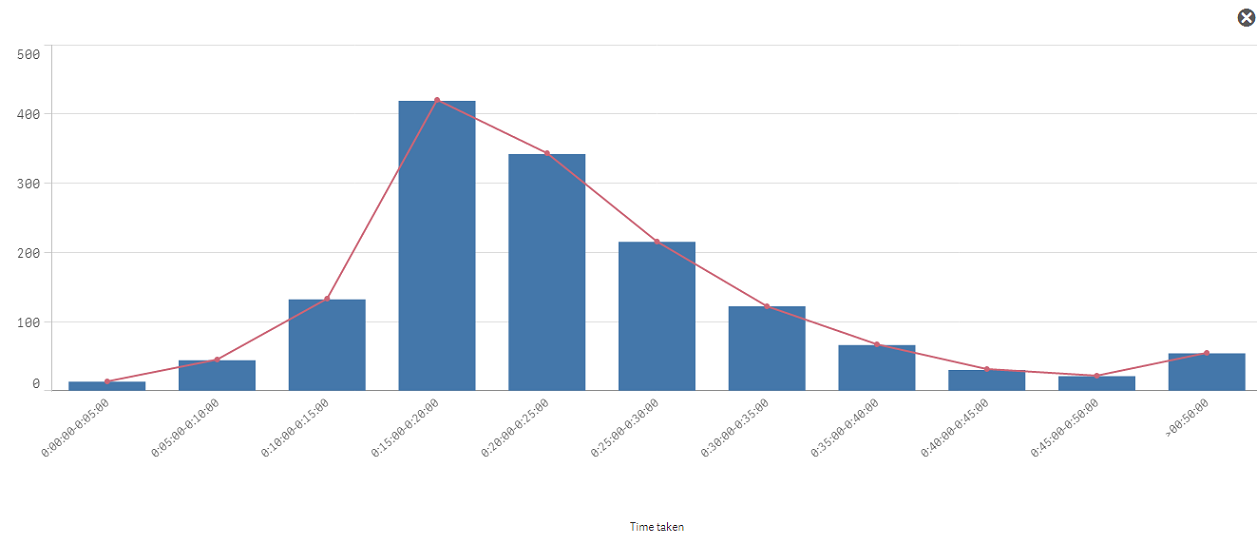
I am not sure is this correct.
I am using same expression for both bar and line.
Dimensions: class([`total_time_taken`],'00:05:00.000','Timetaken')
Measures:
Bar Graph: count({$<subject_id={'2'},subject_status={'passed','completed'}>}user_id)
Line : count({$<subject_id={'2'},subject_status={'passed','completed'}>}user_id)
I am not getting how to use the NORMDIST() for line.
I used Measure for line as below,This is not working.
Only(Normdist(class(user_id,0),Avg(total user_id),Stdev(total user_id), 0))*0*Count(total user_id)
Thanks,
Pramod
- Mark as New
- Bookmark
- Subscribe
- Mute
- Subscribe to RSS Feed
- Permalink
- Report Inappropriate Content
Hi Pramod,
What you are doing appears to be correct to me. I don't believe you need to use the NORMDIST function. The NORMDIST function returns a single figure that describes where the point lies on a known curve.
-Josh
Qlik
- Mark as New
- Bookmark
- Subscribe
- Mute
- Subscribe to RSS Feed
- Permalink
- Report Inappropriate Content
Hi Josh,
Thanks for the reply.
I need to draw a bell curve. for bell curve i need to use the Normdist right?
Explain how to draw a bell curve,
give me the expression for bell curve for above data.
Thanks,
Pramod
- Mark as New
- Bookmark
- Subscribe
- Mute
- Subscribe to RSS Feed
- Permalink
- Report Inappropriate Content
Hi Pramod,
As I stated above, no you do not need to use NORMDIST to plot a bell curve. A bell curve is the result of the data you have.
-Josh
Qlik
- Mark as New
- Bookmark
- Subscribe
- Mute
- Subscribe to RSS Feed
- Permalink
- Report Inappropriate Content
Hi henric,
Would you please explain the steps how to create a "bell curve" in qlik sense.
As this post is useful to know about the histogram(bell curve) finding difficult to use it in qlik sense.
because,
1. we don't have input box in qlik sense and you asked to create a new variable with default value 1, but again you assigned 0.2 to it. This is confusing. Is we should use 1 for all types of data or it should be changed according to data.
2. In steps 7 you mentioned Axes page. this page we can't find in qlik sense.
3. In the expression for line:
Only(Normdist(Round(Value,BinWidth),Avg(total Value),Stdev(total Value), 0))*BinWidth*Count(totalValue)
You have used Round(), Avg(), Stdev(), count(), why we are using this what is the functionality of this.
I have attached the sample data and .qvf you check the file and confirm is it correct? if wrong explain where i am going wrong.
Please explain the steps how to do this in Qlik sense it will be helpful.
Thanks,
Pramod
- Mark as New
- Bookmark
- Subscribe
- Mute
- Subscribe to RSS Feed
- Permalink
- Report Inappropriate Content
Sasi,
Can you please send me that graph in qlikview, Please?
So, i have same issue now, i want to create bell curve which you shown in above graph.
Please send that qvw. Might be helpful to me.
- Anil
- « Previous Replies
- Next Replies »