Unlock a world of possibilities! Login now and discover the exclusive benefits awaiting you.
- Qlik Community
- :
- Forums
- :
- Analytics
- :
- New to Qlik Analytics
- :
- Re: How to drill through to details in a Pivot Tab...
- Subscribe to RSS Feed
- Mark Topic as New
- Mark Topic as Read
- Float this Topic for Current User
- Bookmark
- Subscribe
- Mute
- Printer Friendly Page
- Mark as New
- Bookmark
- Subscribe
- Mute
- Subscribe to RSS Feed
- Permalink
- Report Inappropriate Content
How to drill through to details in a Pivot Table
Hi ,
I have a requirement where I have to show the summary level data and then show the details ?
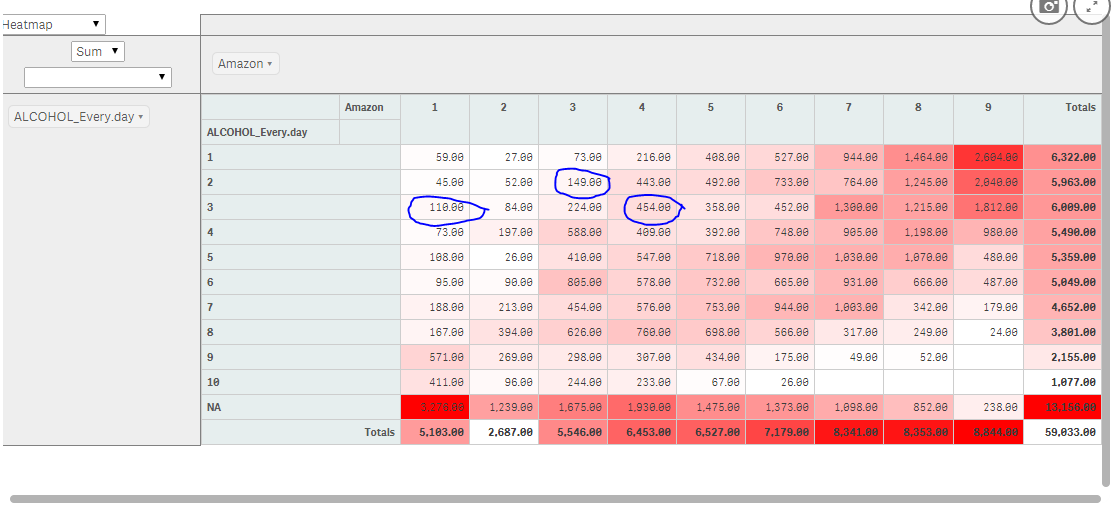
Here are the details of the requirements . In below example I am showing count of postcodes at the intersection of two dimensions in a Pivot Table. If the user click on any cell ( as circled from the blue pen ), I have to show corresponding postcode values . How can I do that ? Post code values are something like this 2000 2009 2010 2011 2015 2016 2018 2019 2020 2021 . So in the first column if user clicks on 110 , user should see those 110 postcode either in a map or in a separate table. Please let me know if anyone knows about this .
I will really appreciate it.
Thanks
Aj
- Mark as New
- Bookmark
- Subscribe
- Mute
- Subscribe to RSS Feed
- Permalink
- Report Inappropriate Content
The ways I have done this is to
Get the user to click on the two dimensions (not the number) and then either depending on circumstances
- have a map or straight table beside the pivot table
- at times I have set up a drill down in the pivot table (set up as a master dimension)
- set up as unticked "fully expanded" with the 2 required dimensions
- Mark as New
- Bookmark
- Subscribe
- Mute
- Subscribe to RSS Feed
- Permalink
- Report Inappropriate Content
Hi Ajay,
Did you get any solution on this?
Please provide if anything you found.
Thanks.