Unlock a world of possibilities! Login now and discover the exclusive benefits awaiting you.
- Qlik Community
- :
- Forums
- :
- Analytics
- :
- New to Qlik Analytics
- :
- How to filter KPI to only one quarter of data?
- Subscribe to RSS Feed
- Mark Topic as New
- Mark Topic as Read
- Float this Topic for Current User
- Bookmark
- Subscribe
- Mute
- Printer Friendly Page
- Mark as New
- Bookmark
- Subscribe
- Mute
- Subscribe to RSS Feed
- Permalink
- Report Inappropriate Content
How to filter KPI to only one quarter of data?
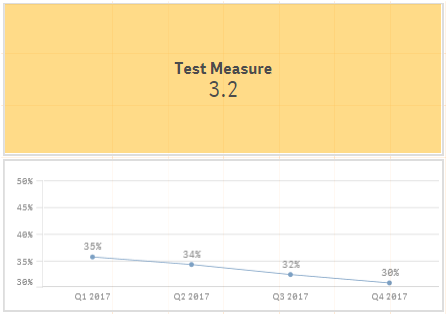
I have two graphics here. The top one is showing an average of all 4 quarters. How do I filter it to only show the latest quarter (Q4 2017)?
Thanks!
- Mark as New
- Bookmark
- Subscribe
- Mute
- Subscribe to RSS Feed
- Permalink
- Report Inappropriate Content
=only({<date = {Q4 2017}>}yourMasure)
- Mark as New
- Bookmark
- Subscribe
- Mute
- Subscribe to RSS Feed
- Permalink
- Report Inappropriate Content
In this case, you'll need to use Set Analysis.
Take as example the top chart is displaying expression Avg([Sales]) while the bottom chart is displaying Sum([Sales]) by Quarter-Year.
The first one should be modified to Avg({<[Quarter-Year]={''Q4 2017"}>}[Sales]). However, does it make sense to have an average for just 1 value?
Hope the unser provided you some insights. Regards,
- Mark as New
- Bookmark
- Subscribe
- Mute
- Subscribe to RSS Feed
- Permalink
- Report Inappropriate Content
It would just be the average of 1 quarter vs 4. Not really 1 value, many values over 1 quarter.
So this would be in the Measure Expression I assume?
- Mark as New
- Bookmark
- Subscribe
- Mute
- Subscribe to RSS Feed
- Permalink
- Report Inappropriate Content
Assuming the Quarter is driven off a master calendar and you don't want to have to re-work the KPI each quarter...
Something like:
Avg({<[Quarter-Year]={"=$(MaxString({[Date]=Today()})>} [Quarter-year])"}>} [Sales])