Unlock a world of possibilities! Login now and discover the exclusive benefits awaiting you.
- Qlik Community
- :
- Forums
- :
- Analytics
- :
- New to Qlik Analytics
- :
- Re: How to filter data that applies to an entire s...
- Subscribe to RSS Feed
- Mark Topic as New
- Mark Topic as Read
- Float this Topic for Current User
- Bookmark
- Subscribe
- Mute
- Printer Friendly Page
- Mark as New
- Bookmark
- Subscribe
- Mute
- Subscribe to RSS Feed
- Permalink
- Report Inappropriate Content
How to filter data that applies to an entire sheet
Hi,
I am trying to achieve the following but cannot figure it out (I am using Qlik Sense Desktop).
I would like to create 1 app with 1 data source (an excel spreadsheet with multiple columns of data) which feeds all the sheets on an app but I need each sheet to have its own filters which do not affect any other sheets.
(In other systems you are able to copy the original data, make amendments to the copy and create charts from the copied data. When updating the original data the copies will automatically update also so multiple data sets are not needed. I have not been able to replicate this behaviour in Qlik.)
here is a simplified example of what I am trying to achieve.
Sheet 1 - Contains all SALES, IT and HR data.
Sheet 2 - Contains only HR data BUT the data field that contains the HR information is not part of the charts.
The charts should only include HR information but the actual dimension would be Location and the measure would be number of employees
Sheet 3 - Contains only SALES data BUT again the SALES filter should not be in the chart. The charts would only contain Sales data but the dimension would be Location and the measure would be number of stores.
I cannot use the filter panes as this affects all the other sheets.
I have tried using a custom dimension but this only works if you are using that dimension in the chart (I would not be). I have tried adding it in to an existing chart and the information does not change.
Is there any other simple way of doing this?
Thanks very much,
Kizzy
- Mark as New
- Bookmark
- Subscribe
- Mute
- Subscribe to RSS Feed
- Permalink
- Report Inappropriate Content
No problem Kizzy
Im sure looking through this videos and the links will help you make progress. CHrome doesnt have any issues with visibility of Qlik functionality unless its a really old browser version.
lt me know if you need any more help.
Regards
Andy
- Mark as New
- Bookmark
- Subscribe
- Mute
- Subscribe to RSS Feed
- Permalink
- Report Inappropriate Content
Hi Omar,
Unfortunately this is not what I need.
On other systems I am able to do the following;
SHEET 1 - is the parent sheet - contains all data which I can run analysis on every data point
SHEET 2 - is child of SHEET 1 but with specific data removed so I can run analysis on every piece of data and do not have to add filters to each chart to remove data because it is already removed in the data manager
SHEET 3 - is child of SHEET 2 but with more data removed. I can also run analysis an all data points without adding additional filters to every chart
The parent sheet is the only one that needs to be updated to update all sheets as the parent feeds all data into the child. I do not want to have multiple excel sheets with different data removed, I should be able to do this in Qlik.
If you think of this in terms of a pivot table in excel, the original data stays the same but when you select the data to create a pivot you can select different sections of data for different pivots but the pivot charts can be created from all data points.
Hope this clarifies my request.
Thanks,
Kizzy
- Mark as New
- Bookmark
- Subscribe
- Mute
- Subscribe to RSS Feed
- Permalink
- Report Inappropriate Content
Kizzy I think you are getting confused with the features and functionality of excel vs qlik.
Perhaps if you mock up what you want in excel and share, it will be easier to visualize what you need and help guide you to the best solution.
Regards
Andy
- Mark as New
- Bookmark
- Subscribe
- Mute
- Subscribe to RSS Feed
- Permalink
- Report Inappropriate Content
Hi Andy,
I have created a word doc with some screen shots of some fake data along with the charts I was able to create in Power BI. These are the charts/functionality I am trying to recreate in Qlik.
There is no option to add word docs to my response, is there any other way I can send them to you?
I appreciate your help.
Thanks,
Kizzy
- Mark as New
- Bookmark
- Subscribe
- Mute
- Subscribe to RSS Feed
- Permalink
- Report Inappropriate Content
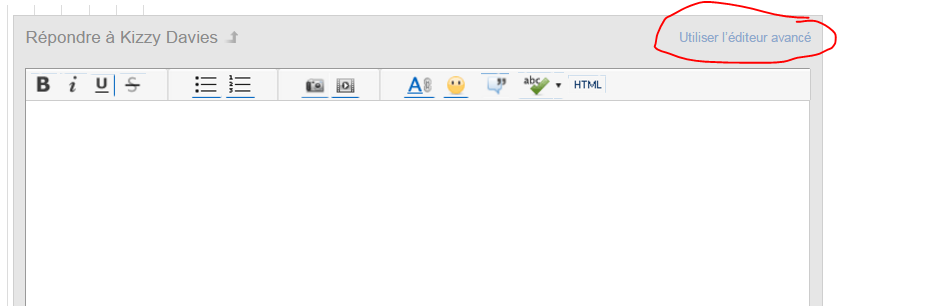
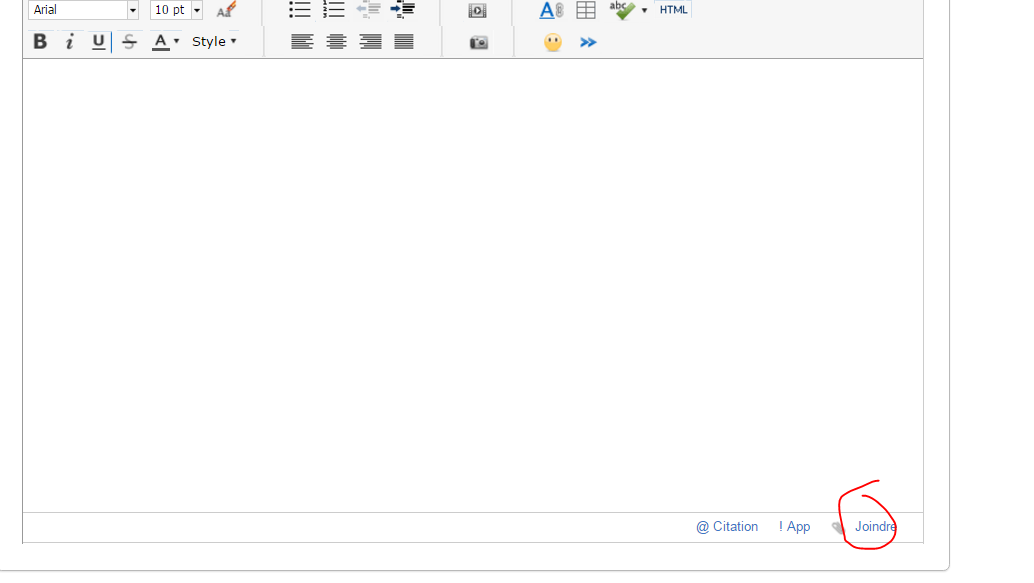
If you go to the advanced editor when you reply there is a tool to attach external documents to the thread.
- Mark as New
- Bookmark
- Subscribe
- Mute
- Subscribe to RSS Feed
- Permalink
- Report Inappropriate Content
Hi Andy,
There was no advanced editor option on the individual reply back to you but I created a doc file upload and sent it through to the data market team. I have added you as an approver.
Thanks,
Kizzy
- Mark as New
- Bookmark
- Subscribe
- Mute
- Subscribe to RSS Feed
- Permalink
- Report Inappropriate Content
Hi Kizzy,
- Mark as New
- Bookmark
- Subscribe
- Mute
- Subscribe to RSS Feed
- Permalink
- Report Inappropriate Content
DOH!! Thanks Omar.
- Mark as New
- Bookmark
- Subscribe
- Mute
- Subscribe to RSS Feed
- Permalink
- Report Inappropriate Content
Hi,
I have to say big thanks for the quick turnaround on my endless questions.
Using the youtube guides I have now worked out how filter using the measure expressions. Below is an example.
Sum({$<GG={14,15,16}>}Number of Reqs)
Although I have an additional question.
How to create the same expression when the original measure already a master measure?
i.e. how to integrate the above expression which only includes data from grades 14, 15 and 16 with the existing measure below.
sum([Approve to Close]) / sum([Number of Openings])
Attached is a screen shot of the Qlik chart showing what kind of chart I am using.
Thanks,
Kizzy
- Mark as New
- Bookmark
- Subscribe
- Mute
- Subscribe to RSS Feed
- Permalink
- Report Inappropriate Content
You want : sum([Approve to Close]) / sum([Number of Openings]) only for grades 14, 15 and 16?
Is that so?