Unlock a world of possibilities! Login now and discover the exclusive benefits awaiting you.
- Qlik Community
- :
- Forums
- :
- Analytics
- :
- New to Qlik Analytics
- :
- Re: How to find the average of sales by Year, Quar...
- Subscribe to RSS Feed
- Mark Topic as New
- Mark Topic as Read
- Float this Topic for Current User
- Bookmark
- Subscribe
- Mute
- Printer Friendly Page
- Mark as New
- Bookmark
- Subscribe
- Mute
- Subscribe to RSS Feed
- Permalink
- Report Inappropriate Content
How to find the average of sales by Year, Quarter, Month excluding the Years/Quarters/Month that have "0" sales amount?
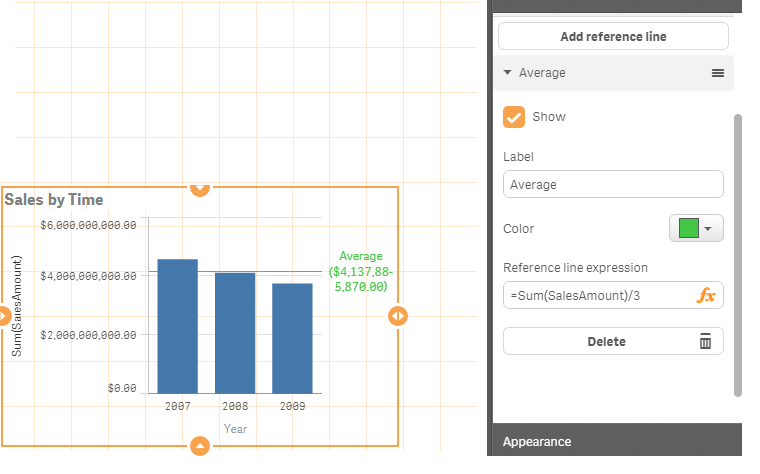
I have a Bar Chart which contains one Measure ( SUM(SalesAMount) ) and one "drill down hierarchy" Dimension called "Date" which has (Year>Quarter>Month). I want to add a reference line which acts a Average of all sales.
Now I need it in such a way that when I go down the hierarchy, it should give that corresponding Average. Additionally there are some years that have zero SalesAmount. I do not wish to have them included in my average.For example : If I press Year, then the reference line should be "Average of all sales by Year" & it should not include the years that have "0" SalesAmount. Now when I press on the Quarter, then the reference line should be "Average of all sales by Quarter" & so on.
Below is what my Chart looks like now. I have presently manipulated the Reference line expression.
I will be really grateful, if anybody could help me with this as soon as they can. Thank you.
Regards,
Leroy
Accepted Solutions
- Mark as New
- Bookmark
- Subscribe
- Mute
- Subscribe to RSS Feed
- Permalink
- Report Inappropriate Content
Hi,
Try like this using set analysis
For Year:
=Sum(SalesAmount) / Count({<SalesAmount={'>0'}>} DISTINCT Year)
Hope this helps you.
Regards,
Jagan.
- Mark as New
- Bookmark
- Subscribe
- Mute
- Subscribe to RSS Feed
- Permalink
- Report Inappropriate Content
Hi Leroy,
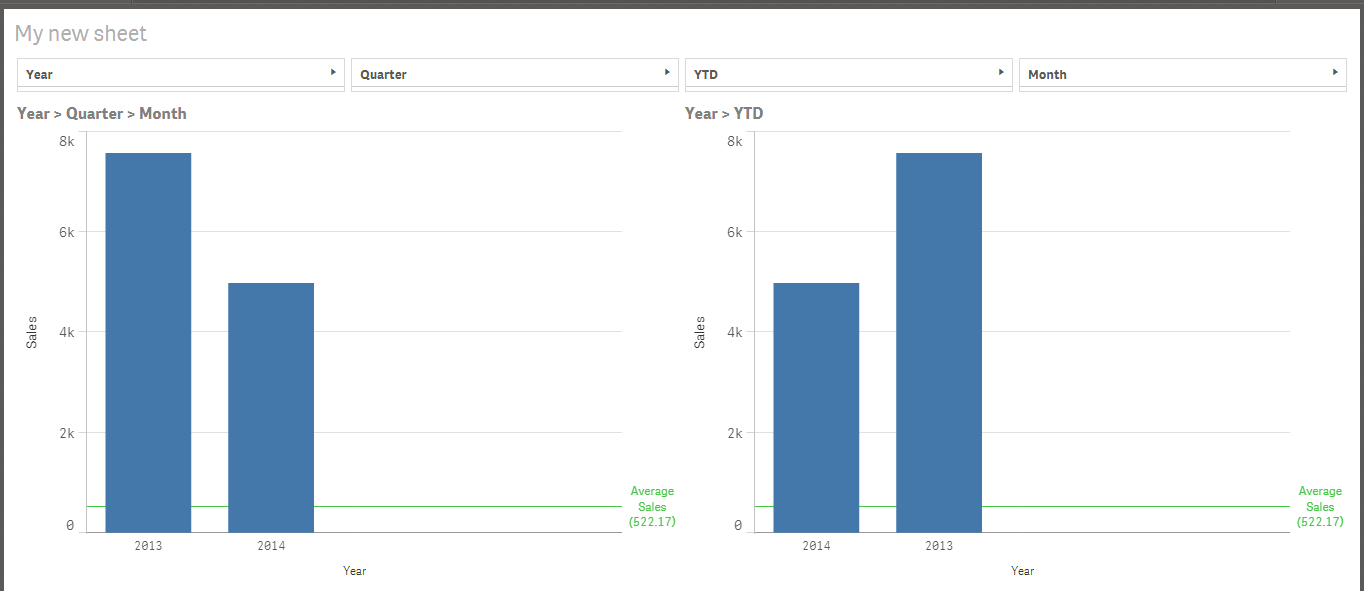
Attached is a really simple example which may do what you want. It has some very basic scripts for aggregations to Quarters and YTD as well as a reference line that updates as you move through the data sets.
Hope this helps.
Kind regards,
Rod
- Mark as New
- Bookmark
- Subscribe
- Mute
- Subscribe to RSS Feed
- Permalink
- Report Inappropriate Content
Hey Rod,
Thanks for the file. I checked it. Then screenshot is as below. But isn't average supposed to be > [("SalesAmount in 2013" + "SalesAmount in 2014") / 2 ]. If so then the value $522.17 looks way less compared to what the average is supposed to be. Looking at the graph, shouldn't it be somewhere close to $6k. Can you please explain me that. Thank you Rod. Appreciate your help.
- Mark as New
- Bookmark
- Subscribe
- Mute
- Subscribe to RSS Feed
- Permalink
- Report Inappropriate Content
Hi,
Try like this using set analysis
For Year:
=Sum(SalesAmount) / Count({<SalesAmount={'>0'}>} DISTINCT Year)
Hope this helps you.
Regards,
Jagan.
- Mark as New
- Bookmark
- Subscribe
- Mute
- Subscribe to RSS Feed
- Permalink
- Report Inappropriate Content
Hey Jagan,
Thanks...That worked beautifully. But it only did for Year. What can I do for Quarter and Month? Should I add another reference line or something?
Please help. Thanks again
- Mark as New
- Bookmark
- Subscribe
- Mute
- Subscribe to RSS Feed
- Permalink
- Report Inappropriate Content
Hi,
For Month:
=Sum(SalesAmount) / Count({<SalesAmount={'>0'}>} DISTINCT Month)
For Quarter:
=Sum(SalesAmount) / Count({<SalesAmount={'>0'}>} DISTINCT Quarter)
There is no GetCurrentField() in Qliksense, so it is diffcult to do this dynamically.
- Mark as New
- Bookmark
- Subscribe
- Mute
- Subscribe to RSS Feed
- Permalink
- Report Inappropriate Content
So do I have to add in two other reference line and point them to Month & Quarter respectively? Is there no other option?
- Mark as New
- Bookmark
- Subscribe
- Mute
- Subscribe to RSS Feed
- Permalink
- Report Inappropriate Content
Not sure in Qliksense.
- Mark as New
- Bookmark
- Subscribe
- Mute
- Subscribe to RSS Feed
- Permalink
- Report Inappropriate Content
Hi Leroy,
Thanks, it was a quick sample so no real logic (or checking by me) hence the Average was just a simple calculation to show it changing.
I think Jagan has covered other options really well as to how you can expand the logic to do what you want.
In terms of workarounds for testing which dimensions is active in the drilldown the following article may give you some ideas: QLIK SENSE: $(=GetCurrentField(Time))
Kind regards,
Rod