Unlock a world of possibilities! Login now and discover the exclusive benefits awaiting you.
- Qlik Community
- :
- Forums
- :
- Analytics
- :
- New to Qlik Analytics
- :
- How to get the indicators beside the bar graph
- Subscribe to RSS Feed
- Mark Topic as New
- Mark Topic as Read
- Float this Topic for Current User
- Bookmark
- Subscribe
- Mute
- Printer Friendly Page
- Mark as New
- Bookmark
- Subscribe
- Mute
- Subscribe to RSS Feed
- Permalink
- Report Inappropriate Content
How to get the indicators beside the bar graph
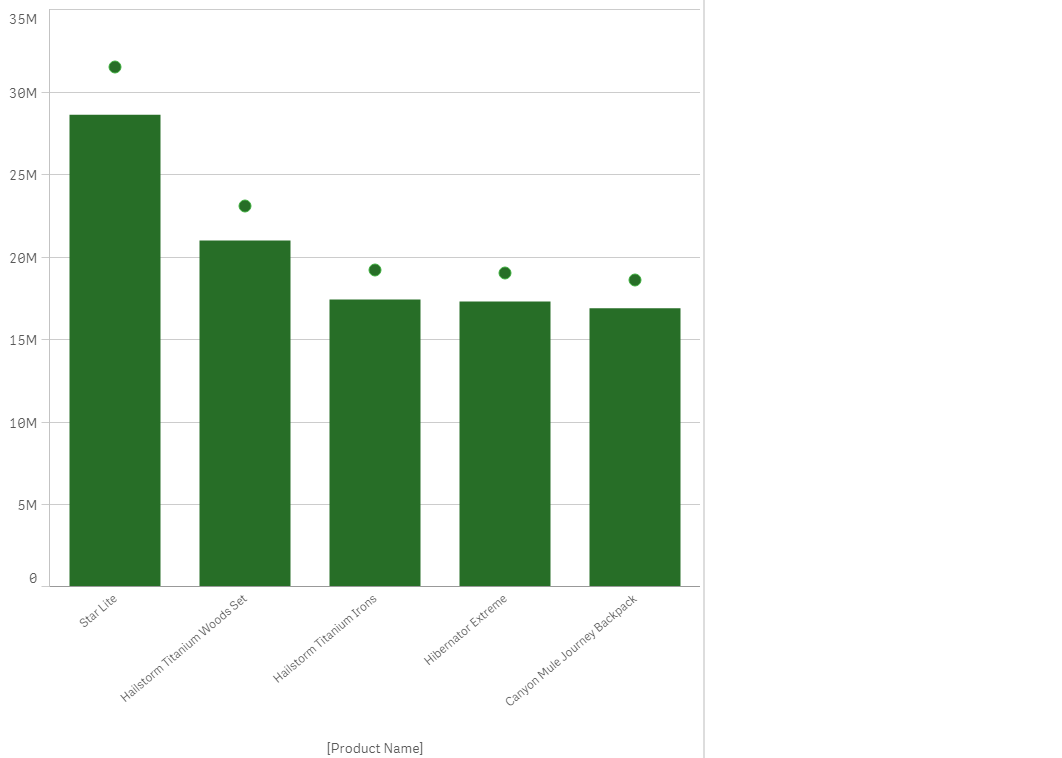
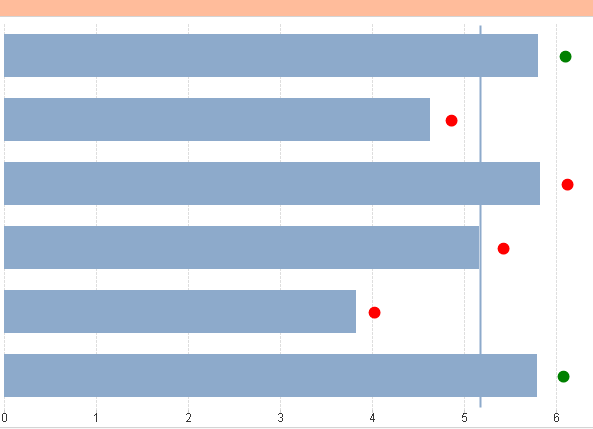
I have attached the .png file of tableau report. I want the indicators to be present besides the bar graph in qlik sense 3.0 , how to achieve that. Based on some values, indicators color turns green and red. Indicators can be any geometrical shapes.
- Mark as New
- Bookmark
- Subscribe
- Mute
- Subscribe to RSS Feed
- Permalink
- Report Inappropriate Content
Make it a combo chart.
One expression is a bar.
Second expression is Symbol.
Style is stacked.
Background color for second expression
- Mark as New
- Bookmark
- Subscribe
- Mute
- Subscribe to RSS Feed
- Permalink
- Report Inappropriate Content
If you managed to do that in Qlik Sense then please post an example app.
talk is cheap, supply exceeds demand
- Mark as New
- Bookmark
- Subscribe
- Mute
- Subscribe to RSS Feed
- Permalink
- Report Inappropriate Content
Thanks for the solution, but in qlik sense how to achieve the red and green color for the second expression. In this how to give red and green color based on some expression for the markers.