Unlock a world of possibilities! Login now and discover the exclusive benefits awaiting you.
- Qlik Community
- :
- Forums
- :
- Analytics
- :
- New to Qlik Analytics
- :
- Re: How to highlight area above a line graph.
- Subscribe to RSS Feed
- Mark Topic as New
- Mark Topic as Read
- Float this Topic for Current User
- Bookmark
- Subscribe
- Mute
- Printer Friendly Page
- Mark as New
- Bookmark
- Subscribe
- Mute
- Subscribe to RSS Feed
- Permalink
- Report Inappropriate Content
How to highlight area above a line graph.
Hi I'm new to Qlik Sense and I've currently made a simple line graph.
Qlik Sense can pretty easily highlight the area under a line graph however I'm having a lot of difficulty in highlighting the area above the line graph while keeping the area below white as before.
I've tried adding another line to the graph above the line that I'm interested in so that the area under each line is a different colour. However when I do this I lose the ability to choose the colour of the lines and area highlight, which I need.
Help would be appreciated.
- Mark as New
- Bookmark
- Subscribe
- Mute
- Subscribe to RSS Feed
- Permalink
- Report Inappropriate Content
Will you able to provide sample?
- Mark as New
- Bookmark
- Subscribe
- Mute
- Subscribe to RSS Feed
- Permalink
- Report Inappropriate Content
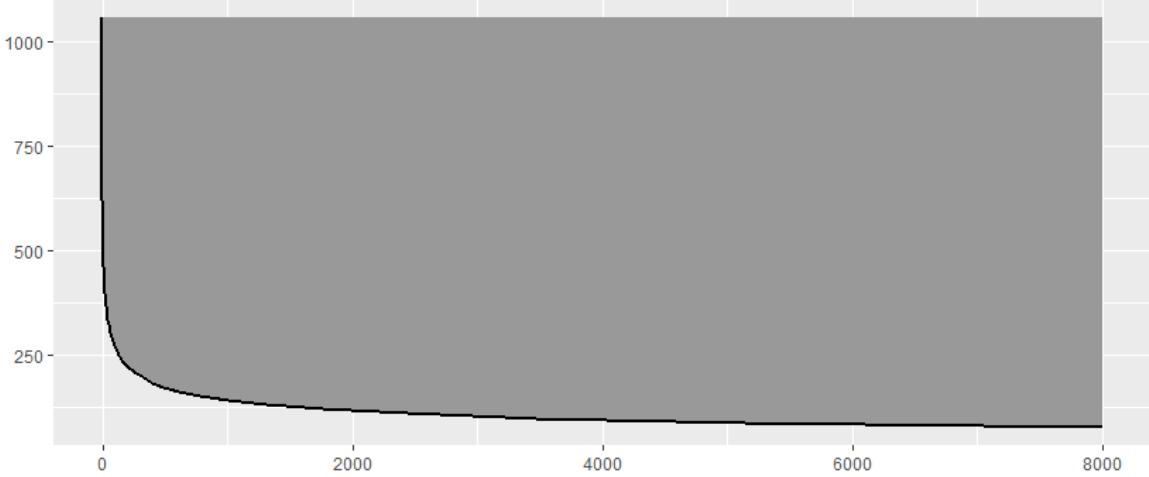
I would like to create something like this. The data is just two columns of numbers.
- Mark as New
- Bookmark
- Subscribe
- Mute
- Subscribe to RSS Feed
- Permalink
- Report Inappropriate Content
We have area plot but not on top of Measure which you showed. To deeper we can work around. Better if you can share sample test file to test it?