Unlock a world of possibilities! Login now and discover the exclusive benefits awaiting you.
- Qlik Community
- :
- Forums
- :
- Analytics
- :
- New to Qlik Analytics
- :
- Re: How to ignore selection in a table
- Subscribe to RSS Feed
- Mark Topic as New
- Mark Topic as Read
- Float this Topic for Current User
- Bookmark
- Subscribe
- Mute
- Printer Friendly Page
- Mark as New
- Bookmark
- Subscribe
- Mute
- Subscribe to RSS Feed
- Permalink
- Report Inappropriate Content
How to ignore selection in a table
Hi all.
I have the following problem: When I select a year, and some data doesn't exist for this year, how can I show the value 0 instead of the row not be shown? When nothing is selected, and the table is shown as table below:
| Variable | Values - Sum(Valor) |
|---|---|
| A | 100 |
| B | 200 |
| C | 0 |
| D | 30 |
| F | 0 |
But if I select something, like year = 2015, since there's no data for row C and F, only the rows A, B and D are shown.
| Variable | Values - Sum(Valor) |
|---|---|
| A | 30 |
| B | 50 |
| D | 10 |
- Tags:
- sense
- static table
- « Previous Replies
-
- 1
- 2
- Next Replies »
Accepted Solutions
- Mark as New
- Bookmark
- Subscribe
- Mute
- Subscribe to RSS Feed
- Permalink
- Report Inappropriate Content
Hi Janilson
i quickly played with your sample and created an expression that should be close to what you want.
In the load editor i manufactured a data set like this:
LOAD * INLINE [
Variable, Values, Year
A, 100,2014
B, 200,2015
D, 30,2015
];
LOAD * INLINE [
Variable
A
B
C
D
F
];
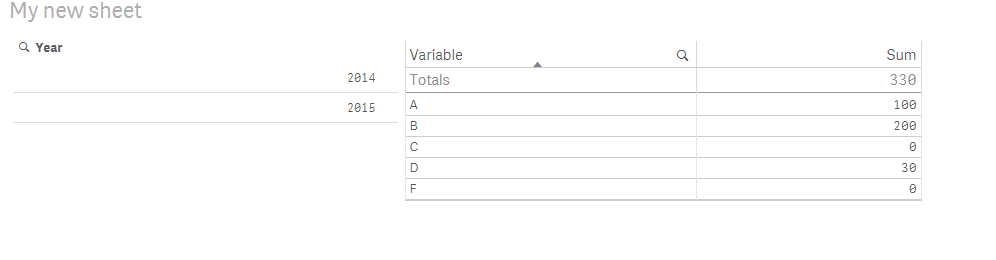
This allows me to create a simple table that looks like this:
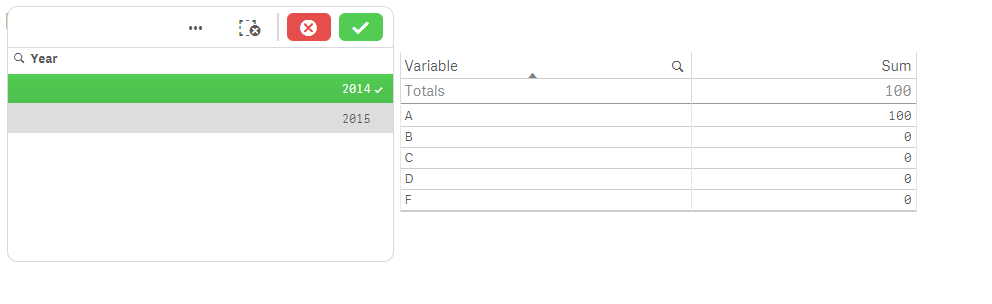
Now... if i change my expression from sum( Variable) to do some conditional subtotaling with the Year filter disregarded when the value is 0...
Sum( {<Year=>} if( aggr(sum(Values),Variable)=0, aggr(sum({<Year=>} Values),Variable) , aggr(sum( Values),Variable) ) )
Then i can get the desired filtered effect as follows:
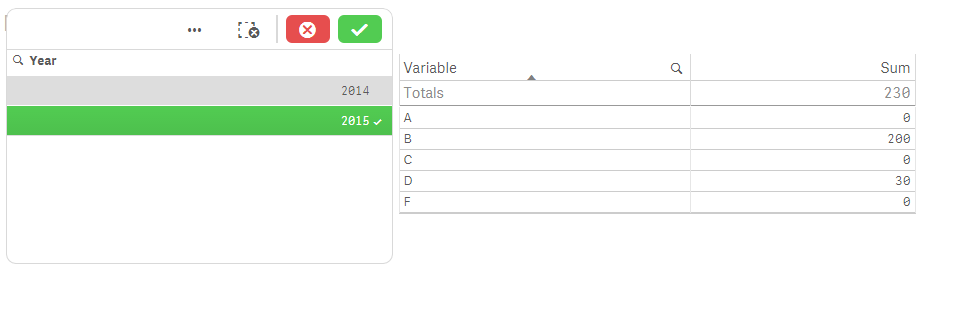
and
- Mark as New
- Bookmark
- Subscribe
- Mute
- Subscribe to RSS Feed
- Permalink
- Report Inappropriate Content
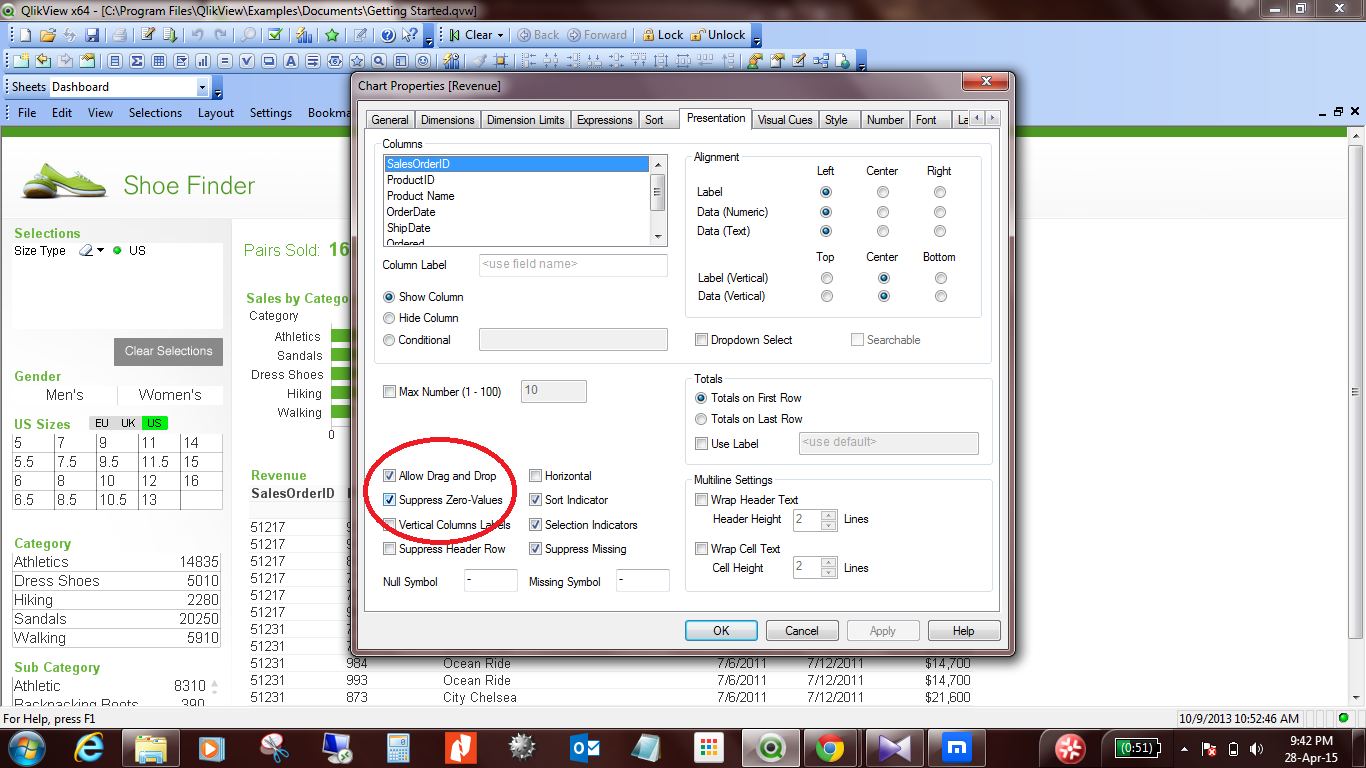
go to chart properties >> presentation >> uncheck supress zero values
- Mark as New
- Bookmark
- Subscribe
- Mute
- Subscribe to RSS Feed
- Permalink
- Report Inappropriate Content
Hi Janilson,
'Suppress Zero Value' is set to TRUE by default, you just need to un-tick the option on the presentation tab of your charts properties.
Andy
- Mark as New
- Bookmark
- Subscribe
- Mute
- Subscribe to RSS Feed
- Permalink
- Report Inappropriate Content
Thanks for quick answer.
I am using a Table Object in Qlik Sense, I've searched in it and in fact, I did found something like it. (Monstrar valores nulos = Show null values) as figure below.
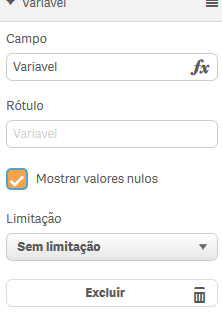
But when I select something, my table get smaller, and only field sum(value) that exists are shown.
- Mark as New
- Bookmark
- Subscribe
- Mute
- Subscribe to RSS Feed
- Permalink
- Report Inappropriate Content
Hi Janilson - please take a look at this two part video series on Set Analysis - this may help you do what you are looking to do:
- A Beginners' Introduction to Set Analysis (video)
- Set Analysis - Part 2 - Cool Stuff You Can Do (video)
from:
Set Analysis allows you to create metrics using Sets of data that you define, including the ability to ignore current selections.
Let us know how you do.
Please mark the appropriate replies as CORRECT / HELPFUL so our team and other members know that your question(s) has been answered to your satisfaction.
Regards,
Mike Tarallo
Qlik
Mike Tarallo
Qlik
- Mark as New
- Bookmark
- Subscribe
- Mute
- Subscribe to RSS Feed
- Permalink
- Report Inappropriate Content
I've already saw those examples (congratulations for them by the way), thanks Michael.
I don't know how to use set analysis in measurements and that's what I need.
I want the sum to be simple, if there are values then sum it, if there isn't, then put zero in sum field.
Is it possible to use set analysis in a table dimension so all the rows of the table is shown, even if there's no data to represent/sumarize?
OBS: the metric shall respect the selection, but not the table. But metric will need to show zero in data that it doesn't have.
- Mark as New
- Bookmark
- Subscribe
- Mute
- Subscribe to RSS Feed
- Permalink
- Report Inappropriate Content
Hi Janilson,
Set Analysis is always / only used in Measures and not in dimensions - as it works with an aggregate function such as Sum() or Count() etc.
Let's see if this gets us closer to what you want to do.
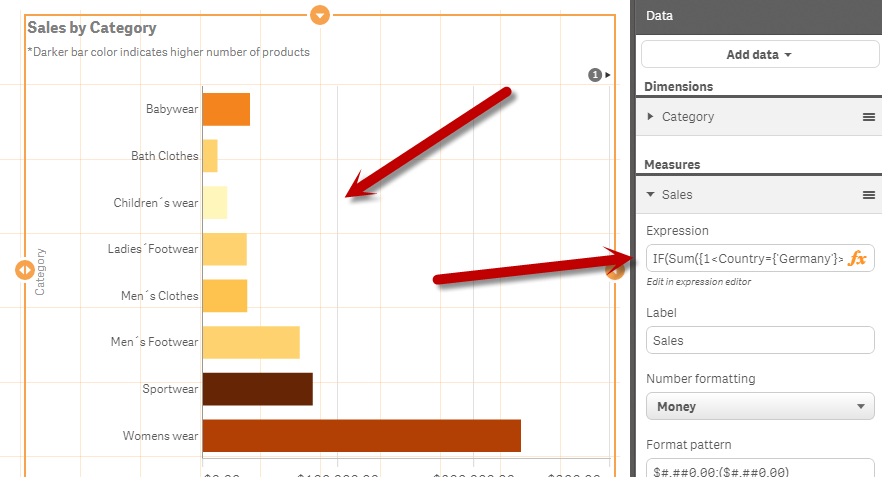
You can combine IF THEN conditional logic in the expression. See this simple example to get an idea:
IF(Sum({1<Country={'Germany'}>}Sales) < 0, 0, Sum({1<Country={'Germany'}>}Sales))
This states:
If the Sum of Sales for the country of Germany (ignoring other selections) is less than 0 - then just use 0, else give me the actual sum of sales for Germany.
Note 1 indicates - to ignore current selections. - You would use this a measure in your table.
Is this closer to what you are looking to do?
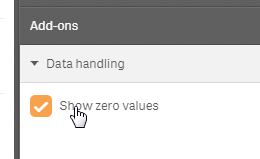
IF not - did you see the option in the Add on section:

Please mark the appropriate replies as CORRECT / HELPFUL so our team and other members know that your question(s) has been answered to your satisfaction.
Regards,
Mike Tarallo
Qlik
Mike Tarallo
Qlik
- Mark as New
- Bookmark
- Subscribe
- Mute
- Subscribe to RSS Feed
- Permalink
- Report Inappropriate Content
Hi Michael.
First of all, thanks again for reply.
I don't want to change calculations or measures. So maybe set analysis is not for me.
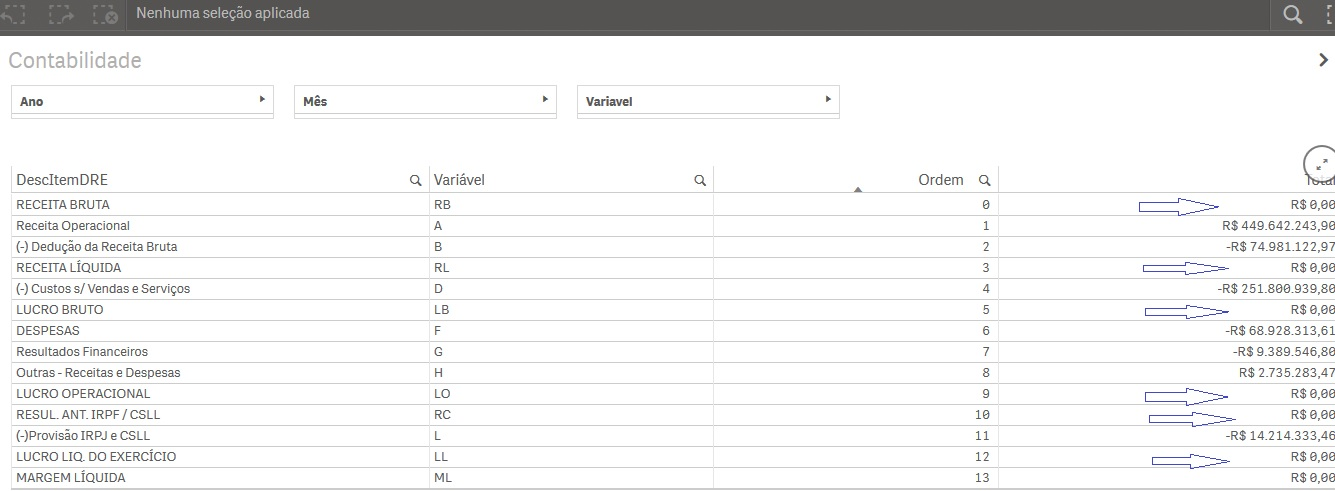
Let me show you my application:
This is when I select nothing, see that all values of table (RB, A, B, RL) are show with some Totals 0, these totals means that there's no data to these rows
If I select some year, only rows that has some data is shown, of course it is the normal thing to happens, all those columns belongs to only one table except the sum(value) that is Total.
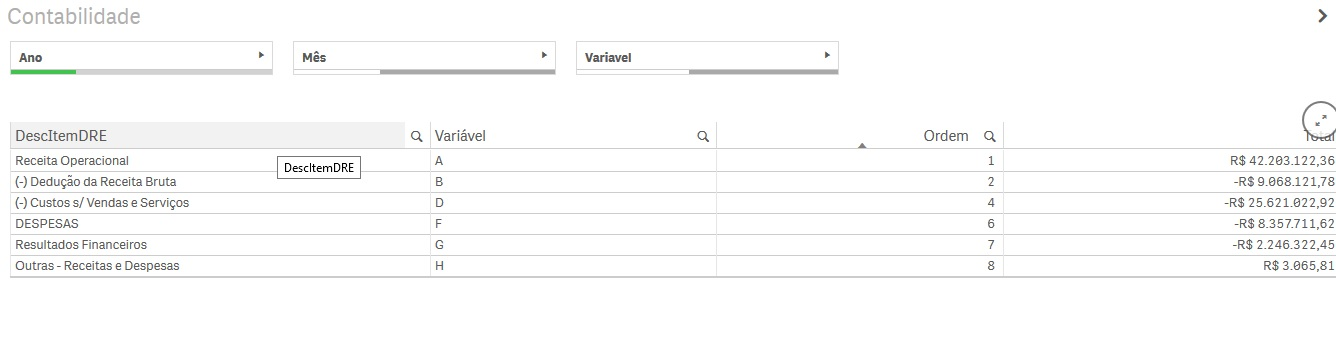
I need the table remains with all rows (even when some filter is selected), if the there's no data then it must show the zero. I do need the measure to change when I use filter, the measure needs to behave according to filter, but I don't want the dimension/table to change, I need every row to be shown, some with zeros, some with values.
OBS: I did see the option to show zeros, this is enabled, but I don't know if this would be enough.
Michael Tarallo <span class="icon-status-icon icon-employee" title="Employee"></span> escreveu:
If the Sum of Sales for the country of Germany (ignoring other selections) is less than 0 - then just use 0, else give me the actual sum of sales for Germany.
Note 1 indicates - to ignore current selections. - You would use this a measure in your table.
Is this closer to what you are looking to do?
IF not - did you see the option in the Add on section:
- Mark as New
- Bookmark
- Subscribe
- Mute
- Subscribe to RSS Feed
- Permalink
- Report Inappropriate Content
Hi Janilson - I am having another colleague take a look.
Regards,
Mike T
Qlik
Mike Tarallo
Qlik
- Mark as New
- Bookmark
- Subscribe
- Mute
- Subscribe to RSS Feed
- Permalink
- Report Inappropriate Content
Hi Janilson
i quickly played with your sample and created an expression that should be close to what you want.
In the load editor i manufactured a data set like this:
LOAD * INLINE [
Variable, Values, Year
A, 100,2014
B, 200,2015
D, 30,2015
];
LOAD * INLINE [
Variable
A
B
C
D
F
];
This allows me to create a simple table that looks like this:
Now... if i change my expression from sum( Variable) to do some conditional subtotaling with the Year filter disregarded when the value is 0...
Sum( {<Year=>} if( aggr(sum(Values),Variable)=0, aggr(sum({<Year=>} Values),Variable) , aggr(sum( Values),Variable) ) )
Then i can get the desired filtered effect as follows:
and
- « Previous Replies
-
- 1
- 2
- Next Replies »