Unlock a world of possibilities! Login now and discover the exclusive benefits awaiting you.
- Qlik Community
- :
- Forums
- :
- Analytics
- :
- New to Qlik Analytics
- :
- Re: How to make Current Year and Previous Year in ...
- Subscribe to RSS Feed
- Mark Topic as New
- Mark Topic as Read
- Float this Topic for Current User
- Bookmark
- Subscribe
- Mute
- Printer Friendly Page
- Mark as New
- Bookmark
- Subscribe
- Mute
- Subscribe to RSS Feed
- Permalink
- Report Inappropriate Content
How to make Current Year and Previous Year in one Member Dimension Chart
Hi Experts,
I would like to ask how to make current year and previous year sales comparison in one member dimension.
The bars should have 2 measures which are current year and previous year.
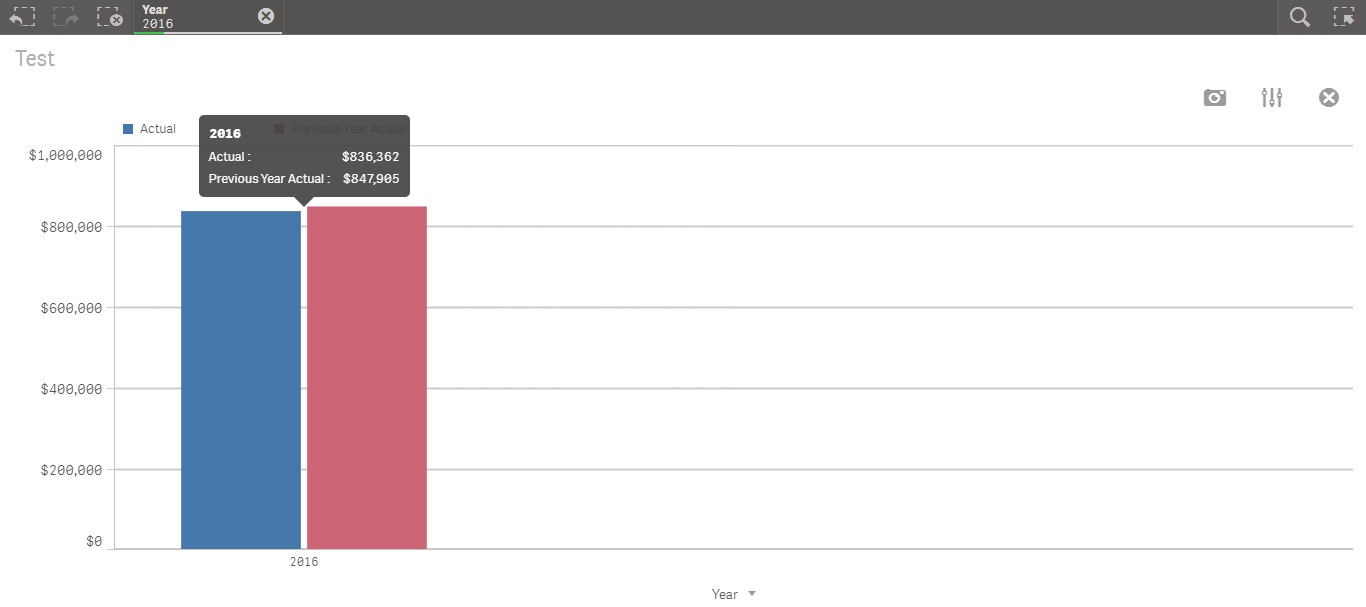
Below is what i am expecting to have.
Right here, i use firstsortedvalue in formula.
You will see there is only 1 member dimension (2016) that has detail of current year and previous year. This is what i want.
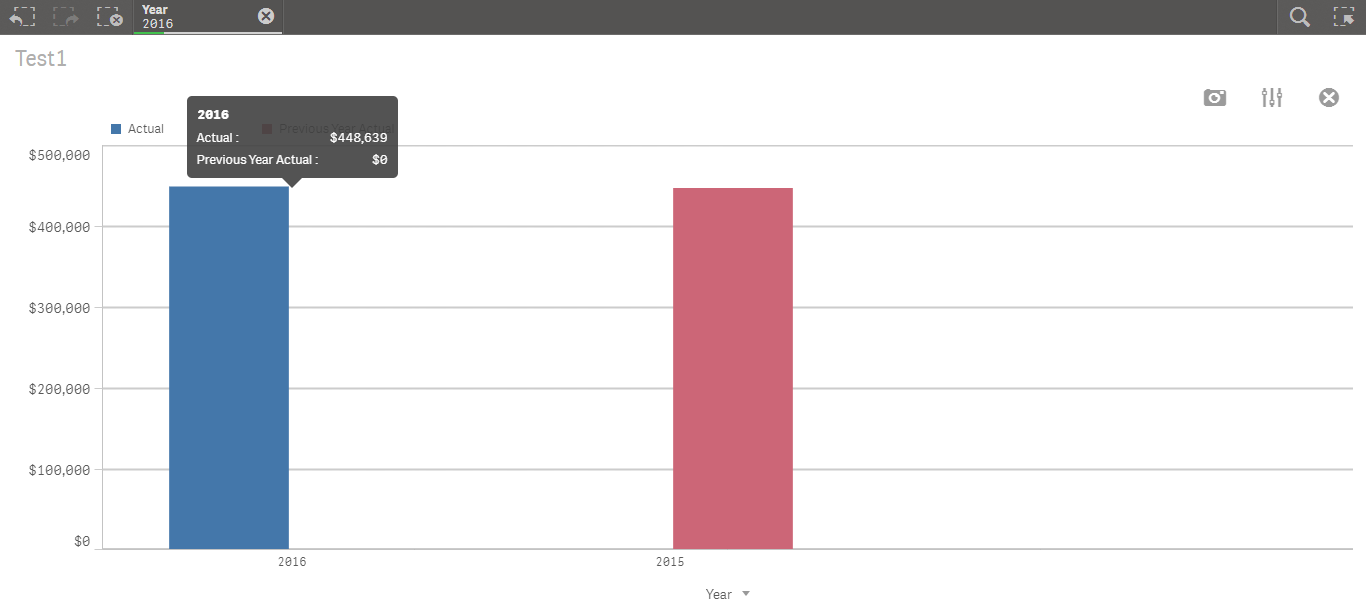
Below is what i currently have.
Right here, instead of using firstsortedvalue formula, i use only simple sum and set analysis because unfortunately there is particular reason i cannot use firstsortedvalue formula.
You will see there are 2 separate member dimensions (2016 and 2017). This is NOT what i want.
I would be really grateful if would kindly give feedback upon this question.
Thanks Fellas.
Regards,
Handriko Naftali
- Mark as New
- Bookmark
- Subscribe
- Mute
- Subscribe to RSS Feed
- Permalink
- Report Inappropriate Content
Hi Handriko,
You can use the seperate table for this requirement in the backend using "resident" option.
table2:
Year,
Measure 1, #Current Year Aggregated measure
Measure 2, #Previous year aggregated measure
Resident table1;
Idea is that you are mapping both the measures to one year and that way your intended chart will be created.
If this explanation is not enough, let me know and I'll post the script from my qliksense app.