Unlock a world of possibilities! Login now and discover the exclusive benefits awaiting you.
- Qlik Community
- :
- Forums
- :
- Analytics
- :
- New to Qlik Analytics
- :
- How to make Qlik Sense table display all rows
- Subscribe to RSS Feed
- Mark Topic as New
- Mark Topic as Read
- Float this Topic for Current User
- Bookmark
- Subscribe
- Mute
- Printer Friendly Page
- Mark as New
- Bookmark
- Subscribe
- Mute
- Subscribe to RSS Feed
- Permalink
- Report Inappropriate Content
How to make Qlik Sense table display all rows
I'm trying to display selling information for each customer, with each customer hundreds of rows. But straight table is not displaying everything for a customer, unless I click on that customer.
I think that is because my data scale is too large. Is there a way to display everything without clicking on one customer?
- « Previous Replies
- Next Replies »
Accepted Solutions
- Mark as New
- Bookmark
- Subscribe
- Mute
- Subscribe to RSS Feed
- Permalink
- Report Inappropriate Content
Hi Wanyun,
The next step is to create a fresh Qlik Sense Application loading the Customer and Items data (the one giving you grief at the moment), adding the straight table with the customer and item columns.
Would it be possible for you to post the QVF without data?
A journey of a thousand miles begins with a single step.
- Mark as New
- Bookmark
- Subscribe
- Mute
- Subscribe to RSS Feed
- Permalink
- Report Inappropriate Content
Hi Wanyun,
I am trying to understand the requirement you are trying to implement, basically you want to display all the sales transactions for all your customers in the back-end database; Straight Table should be able to do it, but, I am wondering why? QlikSense is the perfect tool to dice-slice information, but dump all the back-end data at once could be challenging; you could be talking about 1,000 customers, each one with 100 sales transactions (invoices) and each invoice with 10 products, with this optimistic figures you are expecting 1000 x 100 x 10 = 1,000,000 rows to be shown on the UI, why? or who would be able to read (or work) 1 million rows on the screen (if you are lucky, you will be able to fit 30 or 40 rows per screen).
My question regarding this requirement is: Why do you want that? what is the real reason to show all the back-end transactions on the screen? the answer to these questions may lead to a different approach to sort out this requirement.
Hope this helps,
Arnaldo
A journey of a thousand miles begins with a single step.
- Mark as New
- Bookmark
- Subscribe
- Mute
- Subscribe to RSS Feed
- Permalink
- Report Inappropriate Content
Hello, can you add a print screen?
- Mark as New
- Bookmark
- Subscribe
- Mute
- Subscribe to RSS Feed
- Permalink
- Report Inappropriate Content
Hi Arnaldo, thank you for the reply. Actually it's not displaying sales transactions. The user wants to see the selling information for hundreds of items each customer, so there will be one row for every customer-item, and end up being hundreds of rows per customer.
- Mark as New
- Bookmark
- Subscribe
- Mute
- Subscribe to RSS Feed
- Permalink
- Report Inappropriate Content
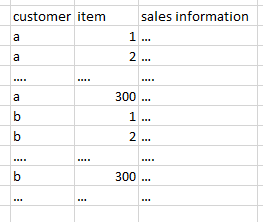
Hi Valeria, I'm not able to show a print screen with real data. Here's the scenario:
I need to show 300 rows (since there're 300 items to analysis) for each customer:
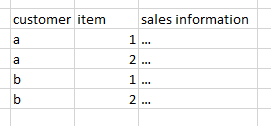
But this is what straight table in Qlik Sense shows:
- Mark as New
- Bookmark
- Subscribe
- Mute
- Subscribe to RSS Feed
- Permalink
- Report Inappropriate Content
you can use the pivot table. so under customer items will be shown
- Mark as New
- Bookmark
- Subscribe
- Mute
- Subscribe to RSS Feed
- Permalink
- Report Inappropriate Content
Hi arul, I tried with pivot table as well. Same with straight table, showing 2 items for each customer only.
- Mark as New
- Bookmark
- Subscribe
- Mute
- Subscribe to RSS Feed
- Permalink
- Report Inappropriate Content
If multiple rows are identical in every column then Qlik will only show the row one time. Is that what you are experiencing?
Otherwise it should show all rows as far as I know.
- Mark as New
- Bookmark
- Subscribe
- Mute
- Subscribe to RSS Feed
- Permalink
- Report Inappropriate Content
Hi Mark, no rows are the identical. I'm have problem displaying too much rows.
- Mark as New
- Bookmark
- Subscribe
- Mute
- Subscribe to RSS Feed
- Permalink
- Report Inappropriate Content
I have to ask. Do you have any kind of filtering going on in an expression in the table (Set analysis)?
Are you sure that you actually have 300 rows of data that you loaded from your script?
I have always had the opposite problem. I want to limit how many rows I display in a straight table. I don't recall every running into not seeing all of them.
- « Previous Replies
- Next Replies »