Unlock a world of possibilities! Login now and discover the exclusive benefits awaiting you.
- Qlik Community
- :
- Forums
- :
- Analytics
- :
- New to Qlik Analytics
- :
- Re: How to make bar chart which shows comparison a...
- Subscribe to RSS Feed
- Mark Topic as New
- Mark Topic as Read
- Float this Topic for Current User
- Bookmark
- Subscribe
- Mute
- Printer Friendly Page
- Mark as New
- Bookmark
- Subscribe
- Mute
- Subscribe to RSS Feed
- Permalink
- Report Inappropriate Content
How to make bar chart which shows comparison at current year and previous year at product types?
Hi,
How to make bar chart which shows comparison at current year and previous year at product types? and if my date datatype is in char variable format how to convert to date format ?
- « Previous Replies
-
- 1
- 2
- Next Replies »
Accepted Solutions
- Mark as New
- Bookmark
- Subscribe
- Mute
- Subscribe to RSS Feed
- Permalink
- Report Inappropriate Content
The script below using an inline load seems to work.
Data :
Load
Date ( AddYears( Date, -1 ) , 'YYYY-MM' ) as [Date Previous Year] ,
*
;
Load
Date ( MakeDate( left(StringDate,4) , right(StringDate,2) ) , 'YYYY-MM' ) as Date ,
*
inline
[
StringDate
1998002
1998003
1998004
]
;
- Mark as New
- Bookmark
- Subscribe
- Mute
- Subscribe to RSS Feed
- Permalink
- Report Inappropriate Content
For converting character strings to Qlik dates have a look at the Date# function.
- Mark as New
- Bookmark
- Subscribe
- Mute
- Subscribe to RSS Feed
- Permalink
- Report Inappropriate Content
Hi Bill,
I tried to convert char to date using date# function, but wen I tried to use function as addyear or addmonth ...the value are not changing .
- Mark as New
- Bookmark
- Subscribe
- Mute
- Subscribe to RSS Feed
- Permalink
- Report Inappropriate Content
Hard to comment without knowing your data and script.
Can you share a sample demonstrating your issue.
- Mark as New
- Bookmark
- Subscribe
- Mute
- Subscribe to RSS Feed
- Permalink
- Report Inappropriate Content
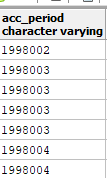
this the format of my date in my database.....I have to convert so that I can use in addyear function
- Mark as New
- Bookmark
- Subscribe
- Mute
- Subscribe to RSS Feed
- Permalink
- Report Inappropriate Content
So that is 7 digits.
- What date would 1998002 convert to ?
- Is it always 7 digits ?
- Mark as New
- Bookmark
- Subscribe
- Mute
- Subscribe to RSS Feed
- Permalink
- Report Inappropriate Content
it should convert to yyyy -1998 MM-02
- Mark as New
- Bookmark
- Subscribe
- Mute
- Subscribe to RSS Feed
- Permalink
- Report Inappropriate Content
The script below using an inline load seems to work.
Data :
Load
Date ( AddYears( Date, -1 ) , 'YYYY-MM' ) as [Date Previous Year] ,
*
;
Load
Date ( MakeDate( left(StringDate,4) , right(StringDate,2) ) , 'YYYY-MM' ) as Date ,
*
inline
[
StringDate
1998002
1998003
1998004
]
;
- Mark as New
- Bookmark
- Subscribe
- Mute
- Subscribe to RSS Feed
- Permalink
- Report Inappropriate Content
Hi Bill ,
yes it is working ..I got the current year and previous year data .... But how to apply in one bar chart ...
What expression should i use to show sum of revenue for current year and previous year with the same column name generated in the above script ?
- Mark as New
- Bookmark
- Subscribe
- Mute
- Subscribe to RSS Feed
- Permalink
- Report Inappropriate Content
Hi Napura Gupta,
You use autocalendar Qlik Sense
In bar chart create a rolling 12 months with =[OrderDate.autoCalendar.YearMonth] as Dimension, rename YearMonth
Expression as by Ex:
sum({<[OrderDate.autoCalendar.YearMonth]=, OrderDate= {">=$(=MonthStart(AddMonths(Max(OrderDate), -11)))<=$(=MonthEnd(AddMonths(Max(OrderDate), 0)))"} >}Sales)
I use -11 and 0 for a YearMonth only.
Ex : If I choose May month-12 as June = a period of 12 months.
Title : ='Sales Selection :' & Num(SUM(${<Year={YearMonth}>}Sales),'$#,##0.00;-$#,##0.00')
Filter shutter=[OrderDate.autoCalendar.YearMonth], rename YearMonth
J-B
- « Previous Replies
-
- 1
- 2
- Next Replies »