Unlock a world of possibilities! Login now and discover the exclusive benefits awaiting you.
- Qlik Community
- :
- Forums
- :
- Analytics
- :
- New to Qlik Analytics
- :
- Re: How to make line chart custom color and the le...
Options
- Subscribe to RSS Feed
- Mark Topic as New
- Mark Topic as Read
- Float this Topic for Current User
- Bookmark
- Subscribe
- Mute
- Printer Friendly Page
Turn on suggestions
Auto-suggest helps you quickly narrow down your search results by suggesting possible matches as you type.
Showing results for
Contributor III
2017-01-06
04:41 AM
- Mark as New
- Bookmark
- Subscribe
- Mute
- Subscribe to RSS Feed
- Permalink
- Report Inappropriate Content
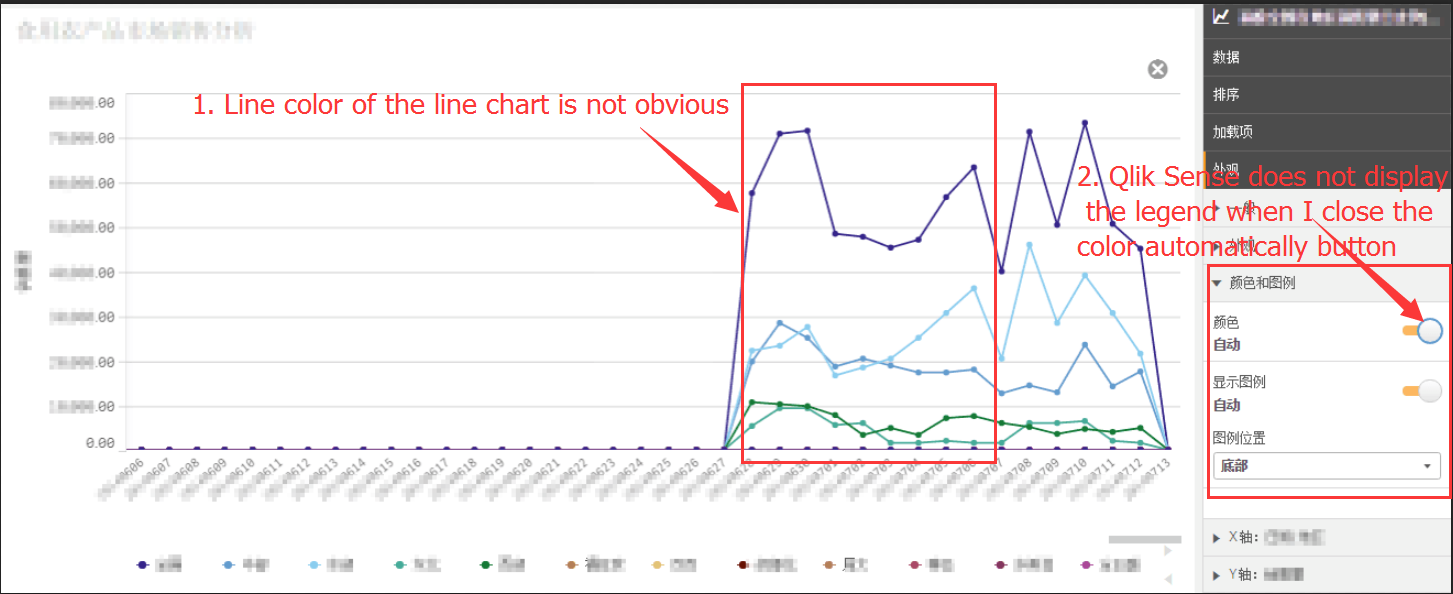
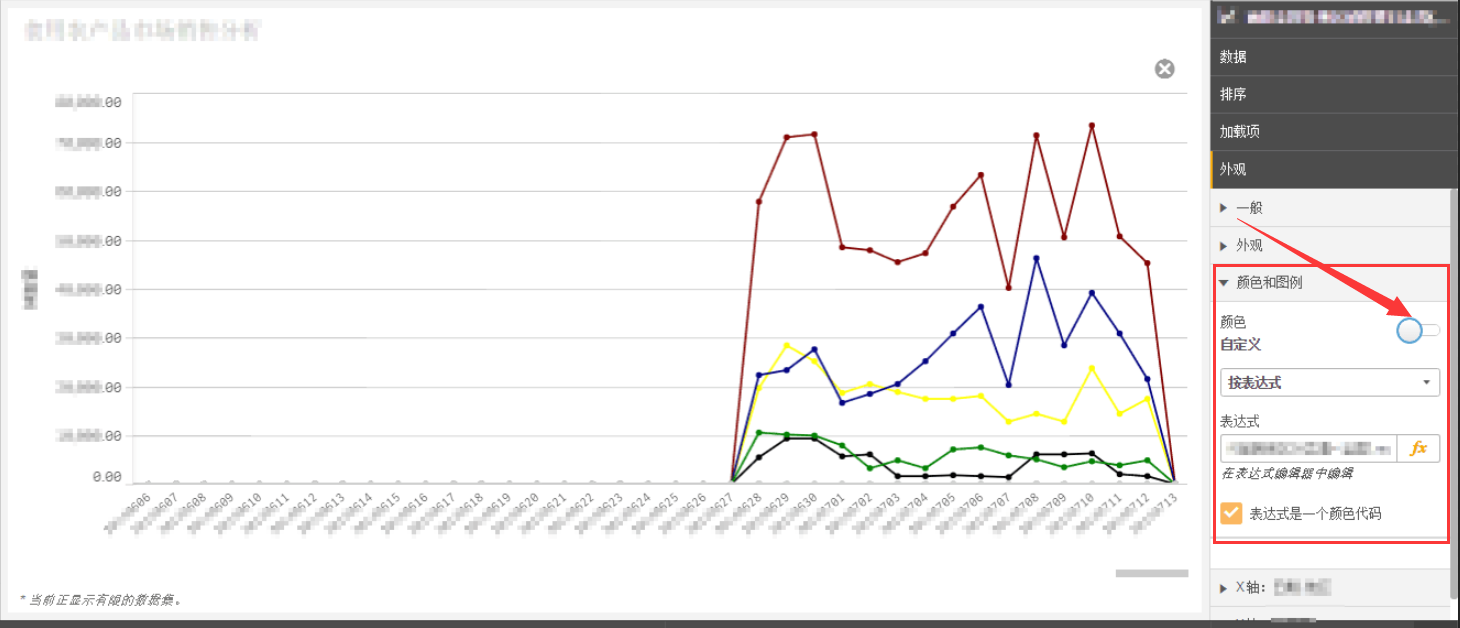
How to make line chart custom color and the legend also shows?
Hi friends,
I want to make the color of line chart distinction more obvious through custom expression. But, the legend is not displayed in Qlik Sense when I turn off color automatically button. Is there any way to solve this problem?
Thanks in advance!
3,583 Views
1 Solution
Accepted Solutions
Specialist
2017-01-06
10:22 AM
- Mark as New
- Bookmark
- Subscribe
- Mute
- Subscribe to RSS Feed
- Permalink
- Report Inappropriate Content
3,192 Views
3 Replies
Specialist
2017-01-06
10:22 AM
- Mark as New
- Bookmark
- Subscribe
- Mute
- Subscribe to RSS Feed
- Permalink
- Report Inappropriate Content
Have you look into this
3,193 Views
Partner - Master III
2017-01-07
04:21 AM
- Mark as New
- Bookmark
- Subscribe
- Mute
- Subscribe to RSS Feed
- Permalink
- Report Inappropriate Content
color by expression doesn't allow to show legends.
If you need to show legends hen you can simple table to create custom Legends as per your expression used In Color by Expression
Anonymous
Not applicable
2018-01-18
09:19 PM
- Mark as New
- Bookmark
- Subscribe
- Mute
- Subscribe to RSS Feed
- Permalink
- Report Inappropriate Content
Sounds lik ea good idea, can you show an example?
3,192 Views
Community Browser