Unlock a world of possibilities! Login now and discover the exclusive benefits awaiting you.
- Qlik Community
- :
- Forums
- :
- Analytics
- :
- New to Qlik Analytics
- :
- How to make selections in bar chart extension(d3.j...
- Subscribe to RSS Feed
- Mark Topic as New
- Mark Topic as Read
- Float this Topic for Current User
- Bookmark
- Subscribe
- Mute
- Printer Friendly Page
- Mark as New
- Bookmark
- Subscribe
- Mute
- Subscribe to RSS Feed
- Permalink
- Report Inappropriate Content
How to make selections in bar chart extension(d3.js)
Hi Everyone,
Here I'm trying to develop bar chart extension using d3.v3.js. I have succeeded in drawing the bar chart. But I'm facing some issues in making the bar chart selections.
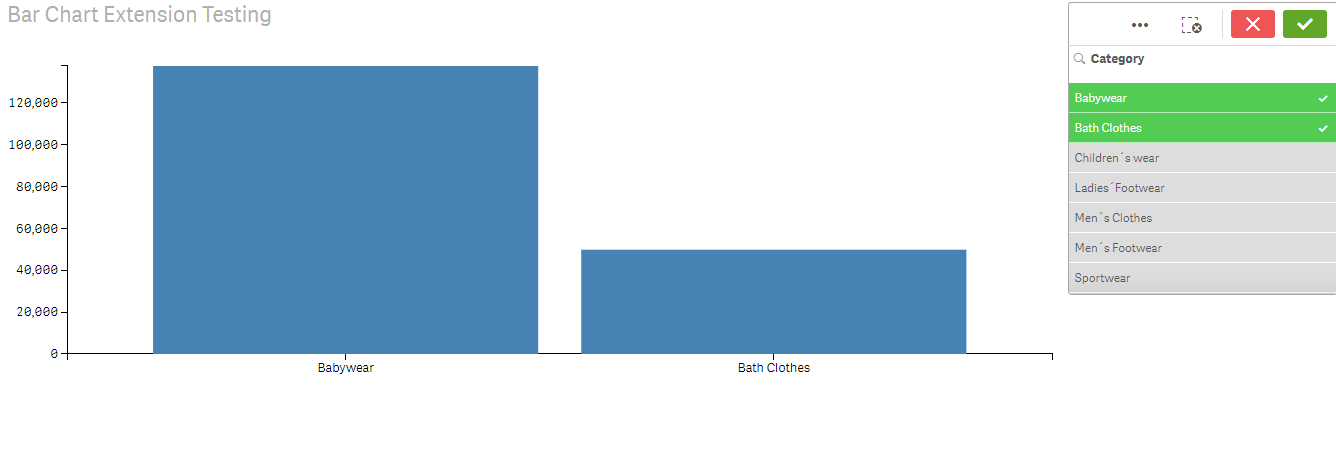
1. When user selects a dimension the chart does not get updated (User needs to click outside to reflect to update the graph )
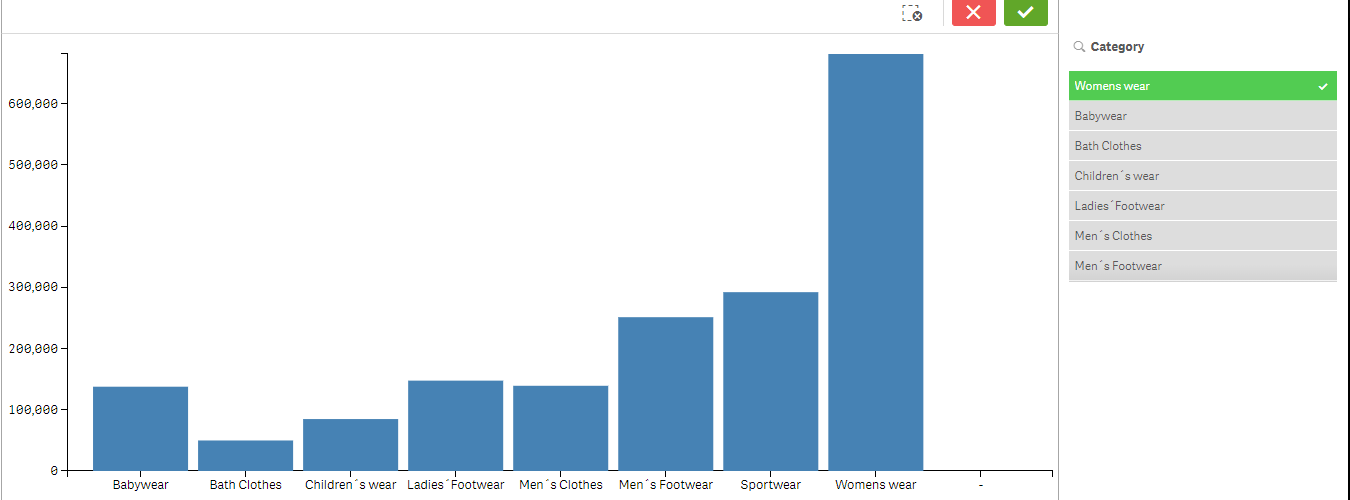
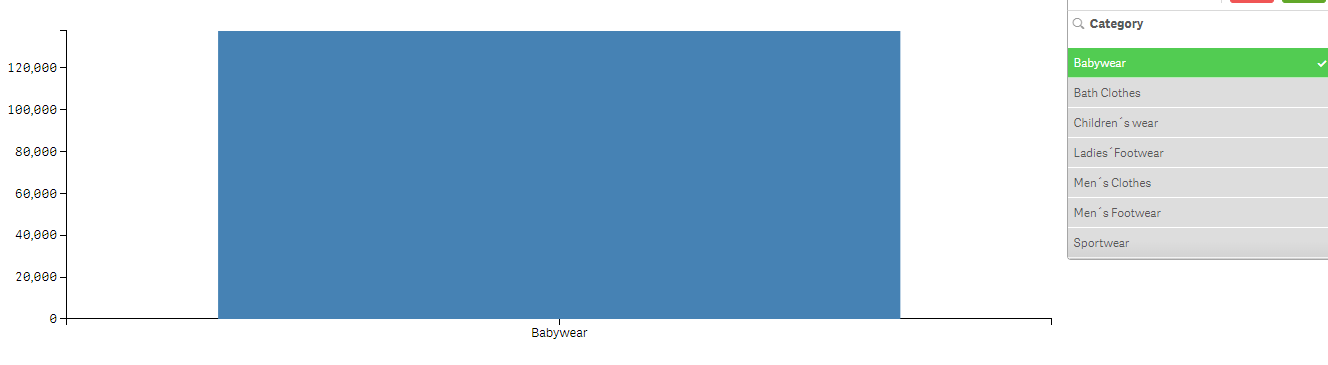
2. If one dimension is selected, the bar associated with it is not displayed properly.
I have attached a sample data app and extension files with question.
Here's the code I have used for the extension:
///////////////////////////////////////////////////////////////////////////////////////////////////////////////////////////////////////////////////////////////////////////////////////////////////
define( [ "qlik", "./d3.v3.min", "css!./style.css"],
function ( qlik, d3) {
return {
initialProperties : {
qHyperCubeDef : {
qDimensions : [],
qMeasures : [],
qInitialDataFetch : [{
qWidth : 4,
qHeight : 1000
}]
}
},
definition:{
type : "items",
component : "accordion",
items : {
dimensions : {
uses : "dimensions",
min : 1,
max : 1
},
measures : {
uses : "measures",
min : 1,
max : 2
},
sorting : {
uses : "sorting"
},
settings : {
uses : "settings",
items: {
general: {
type: "items",
label: "General",
}
}
},
},
},
support : {
snapshot: true,
export: true,
exportData : false
},
paint: function ($element, layout) {
var self= this;
var qMatrix = layout.qHyperCube.qDataPages[0].qMatrix;
var dimensionLabels = layout.qHyperCube.qDimensionInfo.map(function(d) {
return d.qFallbackTitle;
});
var measureLabels = layout.qHyperCube.qMeasureInfo.map(function(d) {
return d.qFallbackTitle;
});
var data = qMatrix.map(function (d){
return {
"Dim1":d[0].qText,
"Metric1":d[1].qNum,
"Index":d[0].qElemNumber
}
});
var width = $element.width();
var height = $element.height();
var id = "container_" + layout.qInfo.qId;
if(document.getElementById(id)){
$("#" + id).empty();
}
else{
$element.append($('<div />').attr("id", id).width(width).height(height));
}
viz(width,height,id,data,measureLabels,dimensionLabels,self,d3);
return qlik.Promise.resolve();
}
};
} );
var viz = function(width,height,id,data,measureLabels,dimensionLabels,self,d3){
var margin = {top: 20, right: 30, bottom: 70, left: 40},
width = width - margin.left - margin.right,
height = height - margin.top - margin.bottom;
var x = d3.scale.ordinal().rangeRoundBands([0, width], 0.1, 0.2);
var y = d3.scale.linear()
.range([height, 0]);
var svg = d3.select("#"+id).append("svg")
.attr("width", width + margin.left + margin.right)
.attr("height", height + margin.top + margin.bottom)
.append("g")
.attr("transform", "translate(" + margin.left + "," + margin.top + ")");
x.domain(data.map(function(d) { return d.Dim1; }));
y.domain([0, d3.max(data, function(d) { return d.Metric1; })]);
svg.append("g")
.attr("class", "x axis")
.attr("transform", "translate(0," + height + ")")
.call(d3.svg.axis().scale(x).orient("bottom"));
svg.append("g")
.attr("class", "y axis")
.call(d3.svg.axis().scale(y).orient("left"));
svg.selectAll(".bar")
.data(data)
.enter().append("rect")
.attr("class", "bar")
.attr("id",function(d){ return d.Index;})
.attr("x", function(d) { return x(d.Dim1); })
.attr("width", x.rangeBand())
.attr("y", function(d) { return y(d.Metric1); })
.attr("height", function(d) { return height - y(d.Metric1); })
.on('click', function(d,i){
console.log("on-click");
var value = parseInt(d3.select(this).attr("id"),10), dim = 0;
self.selectValues(dim, [value], true);
});
!
};
//////////////////////////////////////////////////////////////////////////////////////////////////////////////////////////////////////////////////////////////////////////////////////////////////////////////
Any help is greatly appreciated.
Thank You
Stan