Unlock a world of possibilities! Login now and discover the exclusive benefits awaiting you.
- Qlik Community
- :
- Forums
- :
- Analytics
- :
- New to Qlik Analytics
- :
- Re: How to resolve Price Movement?
- Subscribe to RSS Feed
- Mark Topic as New
- Mark Topic as Read
- Float this Topic for Current User
- Bookmark
- Subscribe
- Mute
- Printer Friendly Page
- Mark as New
- Bookmark
- Subscribe
- Mute
- Subscribe to RSS Feed
- Permalink
- Report Inappropriate Content
How to resolve Price Movement?
Hi Everyone,
I have this concern regarding price movement. I have two available tables: one is a sales data, the other one is a price history. I don't know yet what should I need to do to resolve the scenario. This is to know if the certain SKU is a REGULAR or REDUCED during the Sales Date.
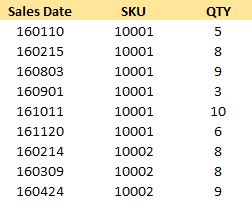
SALES TABLE:
PRICE MOVEMENT TABLE:
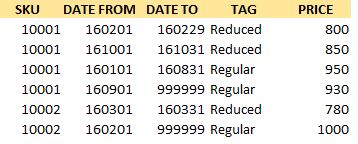
** Take note that in DATE TO the value has 999999 meaning that it is the current price of the SKU, or you can set it as Today().
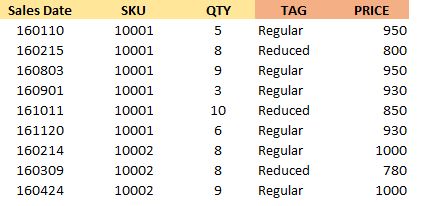
Find below the desired output:
** Since this is QlikSense (to be displayed in). Would it be possible to done the solution in the script? Not in the formula? I was thinking to comeup a Price Movement masterlist where it is breakdown daily.
Thanks ahead for the help!
Regards,
Bill
- « Previous Replies
-
- 1
- 2
- Next Replies »
- Mark as New
- Bookmark
- Subscribe
- Mute
- Subscribe to RSS Feed
- Permalink
- Report Inappropriate Content
The data is similarly like what is in the JDA. The reason I picked row 1 is below, by that time, the SKU is on sale, something like that...
ORIGINALLY THIS IS THE ACTUAL RAW DATA
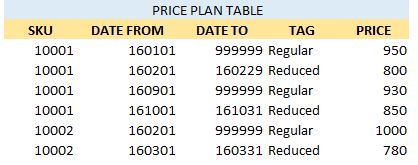
** where 999999 means infinite...
** So to get the ranges and previous record must have an end date
** I sorted them and put end dates to those with 999999
** In my logic, if I found the first record is 999999 then I will leave it as is
** but if next record of the same SKU is still 999999, then I will make it a day before the DATEFROM of the above record. (see image below)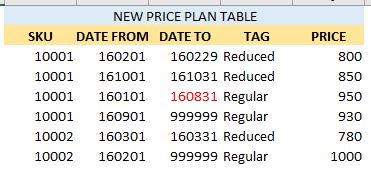
** the red font determine the changes
Yes there is really overlapped on date ranges.
Regards,
Bill
- « Previous Replies
-
- 1
- 2
- Next Replies »