Unlock a world of possibilities! Login now and discover the exclusive benefits awaiting you.
- Qlik Community
- :
- Forums
- :
- Analytics
- :
- New to Qlik Analytics
- :
- How to retain hierarchy view of null values?
- Subscribe to RSS Feed
- Mark Topic as New
- Mark Topic as Read
- Float this Topic for Current User
- Bookmark
- Subscribe
- Mute
- Printer Friendly Page
- Mark as New
- Bookmark
- Subscribe
- Mute
- Subscribe to RSS Feed
- Permalink
- Report Inappropriate Content
How to retain hierarchy view of null values?
The following screen shot shows some sales figures on a calendar hierarchy, and a breakdown of those figures by country. The hierarchy is showing all of the days in the selected month, regardless of whether there were sales.
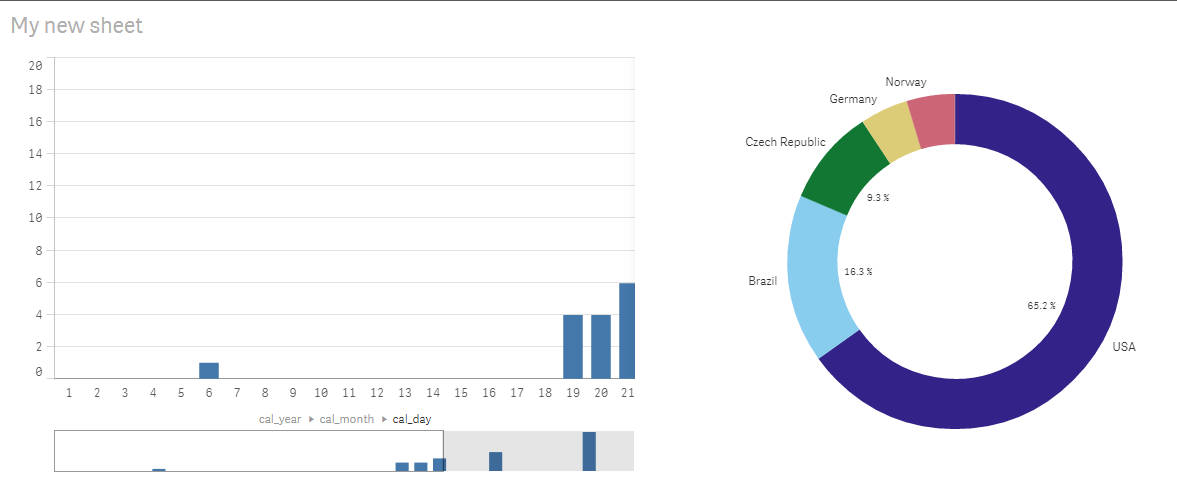
Now I click on a country. I see the bar chart update to show sales for that country in the selected month, but only those days with sales are shown.
How can I show all of the days in this view? The current method makes it awkward when stepping from country to country, as the X-axis keeps changing.
- Mark as New
- Bookmark
- Subscribe
- Mute
- Subscribe to RSS Feed
- Permalink
- Report Inappropriate Content
Change the measure expression so that it ignores the selection: sum({<Country=>} MyValue)
talk is cheap, supply exceeds demand
- Mark as New
- Bookmark
- Subscribe
- Mute
- Subscribe to RSS Feed
- Permalink
- Report Inappropriate Content
Thank you for your reply, Gysbert, but I might not have been clear in my request.
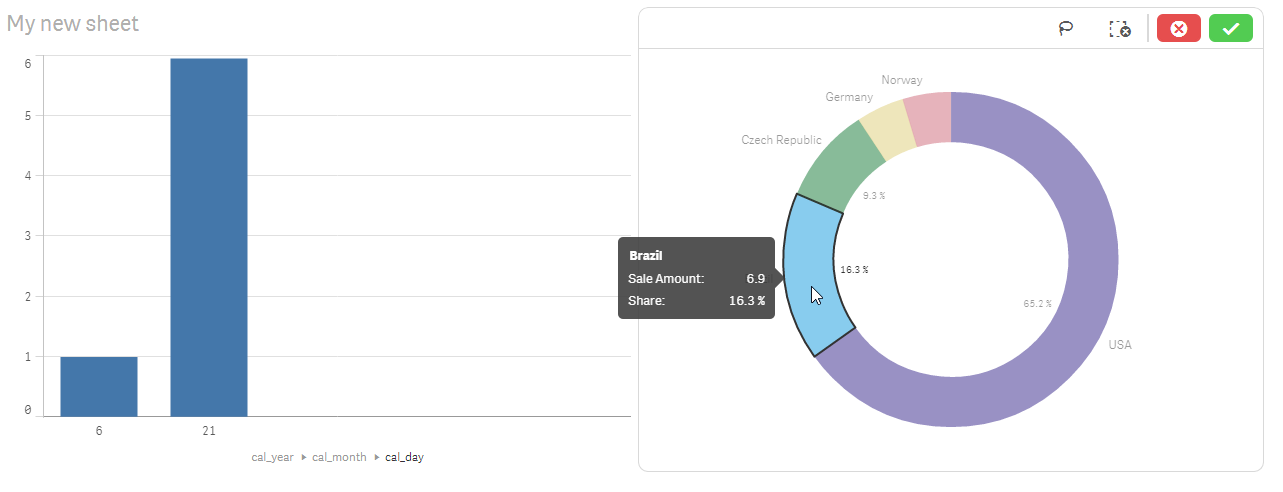
I want the bar chart to appear with the same axis values as the first chart, but only showing bars relevant to Brazil.
In other words, the second bar chart should show all the days of the month, but only the 6th. and 21st. days should have bars visible.
Suggestions?
- Mark as New
- Bookmark
- Subscribe
- Mute
- Subscribe to RSS Feed
- Permalink
- Report Inappropriate Content
Almost 5 years later and this very issue is still boggling many people ; and not only don't I know how to solve it, I can't find any answer to it and everything that feels like it should work doesn't.
There is no middle ground between "show EVERYTHING" and "show everything within what I selected"...