Unlock a world of possibilities! Login now and discover the exclusive benefits awaiting you.
- Qlik Community
- :
- Forums
- :
- Analytics
- :
- New to Qlik Analytics
- :
- Re: How to show all months in a line chart
- Subscribe to RSS Feed
- Mark Topic as New
- Mark Topic as Read
- Float this Topic for Current User
- Bookmark
- Subscribe
- Mute
- Printer Friendly Page
- Mark as New
- Bookmark
- Subscribe
- Mute
- Subscribe to RSS Feed
- Permalink
- Report Inappropriate Content
How to show all months in a line chart
Hello!
I have two tables - one with KPI data and another one with invoice data. The tables are linked on Material and Month. The KPI table has data for each month while the invoice data is missing for some months. What I want is a line chart with KPI and KPI_Month as dimensions and Max(KPI_Value) as measure. After selecting a material, the chart should display the associated KPI for all months and not only for the months with invoice data. Please see the gif below and notice how some months disappear after a material gets selected:
Here is the sample data:
KPI:
LOAD
KPI,
KPI_Value,
DATE(DATE#(KPI_Month, 'MM.YYYY')) AS KPI_Month,
// Material
Material & '-' & DATE(DATE#(KPI_Month, 'MM.YYYY')) AS Material_Month_Key
INLINE [
KPI,KPI_Value,KPI_Month,Material
Target_LBSD,101,07.2016,5000
Target_LBSD,102,08.2016,5000
Target_LBSD,103,09.2016,5000
Target_LBSD,104,10.2016,5000
Target_LBSD,102,11.2016,5000
Target_LBSD,104,12.2016,5000
Target_LBSD,103,01.2017,5000
Target_LBSD,102,02.2017,5000
Target_LBSD,101,03.2017,5000
Target_LBSD,102,04.2017,5000
Target_LBSD,103,05.2017,5000
Target_LBSD,104,06.2017,5000
Target_EGDA,106,07.2016,6000
Target_EGDA,107,08.2016,6000
Target_EGDA,108,09.2016,6000
Target_EGDA,106,10.2016,6000
Target_EGDA,108,11.2016,6000
Target_EGDA,108,12.2016,6000
Target_EGDA,109,01.2017,6000
Target_EGDA,107,02.2017,6000
Target_EGDA,108,03.2017,6000
Target_EGDA,109,04.2017,6000
Target_EGDA,120,05.2017,6000
Target_EGDA,106,06.2017,6000
];


Data:
LOAD
Material AS Material_ID,
Material_Name,
DATE(DATE#(Invoice_Month, 'MM.YYYY')) AS Invoice_Month,
Invoice_Value,
Invoice_Quantity,
Material & '-' & DATE(DATE#(Invoice_Month, 'MM.YYYY')) AS Material_Month_Key
INLINE [
Material,Material_Name,Invoice_Month,Invoice_Value,Invoice_Quantity
5000,LBSD,07.2016,150,2500
5000,LBSD,09.2016,140,2500
5000,LBSD,11.2016,130,2500
5000,LBSD,01.2017,145,2500
5000,LBSD,03.2017,155,2500
5000,LBSD,05.2017,150,2500
6000,EGDA,07.2016,160,2900
6000,EGDA,08.2016,180,2900
6000,EGDA,12.2016,150,2900
6000,EGDA,01.2017,155,2900
6000,EGDA,04.2017,165,2900
6000,EGDA,05.2017,170,2900
];
This should not be too complicated but I was not able to figure it out. I hope somebody has an idea.
Thank you! 
- « Previous Replies
-
- 1
- 2
- Next Replies »
- Mark as New
- Bookmark
- Subscribe
- Mute
- Subscribe to RSS Feed
- Permalink
- Report Inappropriate Content
Hi,
You can exclude the effect of the selection of Material_Name with set analysis by updating the measure in line chart with Max({1<Material_Name = >}KPI_Value).
Let me know if it helps
- Mark as New
- Bookmark
- Subscribe
- Mute
- Subscribe to RSS Feed
- Permalink
- Report Inappropriate Content
Hi,
Try adding an expression:
only({1}Month)
That does not have any visualization (will just be calculated but not shown). This ensure that all months are always shown.
If you want to show all months for which there is data you can do it a bit smarter;
only({1<Month = {">=$(=Min(Month))<=$(=Max(Month))"}>}Month)
- Mark as New
- Bookmark
- Subscribe
- Mute
- Subscribe to RSS Feed
- Permalink
- Report Inappropriate Content
Hi, thank you for responding!
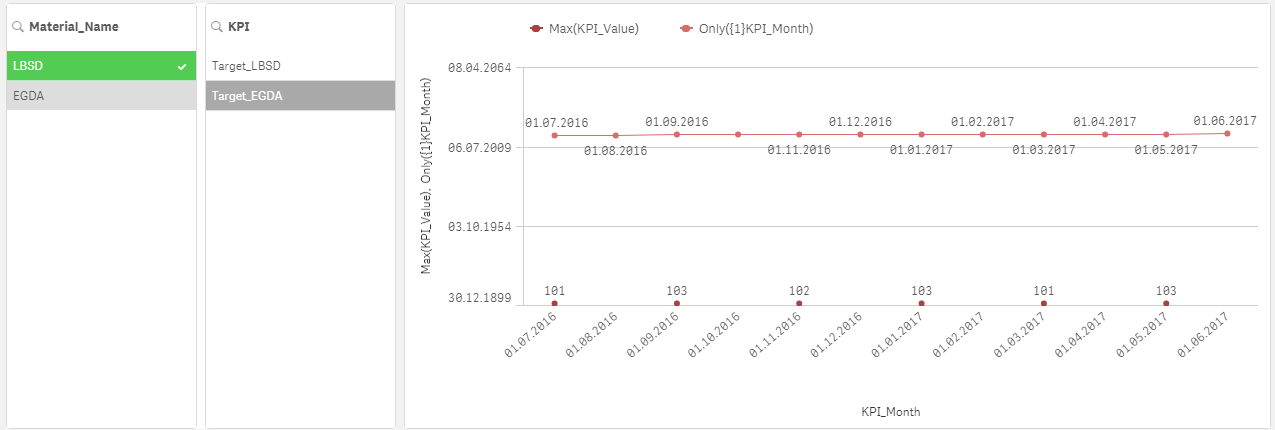
I already have two dimensions, so I can use only one measure. Anyway, I removed one dimension and used your expression. Unfortunately, it adds an additional line and the KPI values are missing again after selecting a material:
- Mark as New
- Bookmark
- Subscribe
- Mute
- Subscribe to RSS Feed
- Permalink
- Report Inappropriate Content
Hi,
maybe this option in graph :

- Mark as New
- Bookmark
- Subscribe
- Mute
- Subscribe to RSS Feed
- Permalink
- Report Inappropriate Content
Hi, I am using Qlik Sense.
- Mark as New
- Bookmark
- Subscribe
- Mute
- Subscribe to RSS Feed
- Permalink
- Report Inappropriate Content
Thanks, I thought about that, but then I lose the association Material to KPI_Value, i.e. when I select a material, all KPI values are shown on the chart:
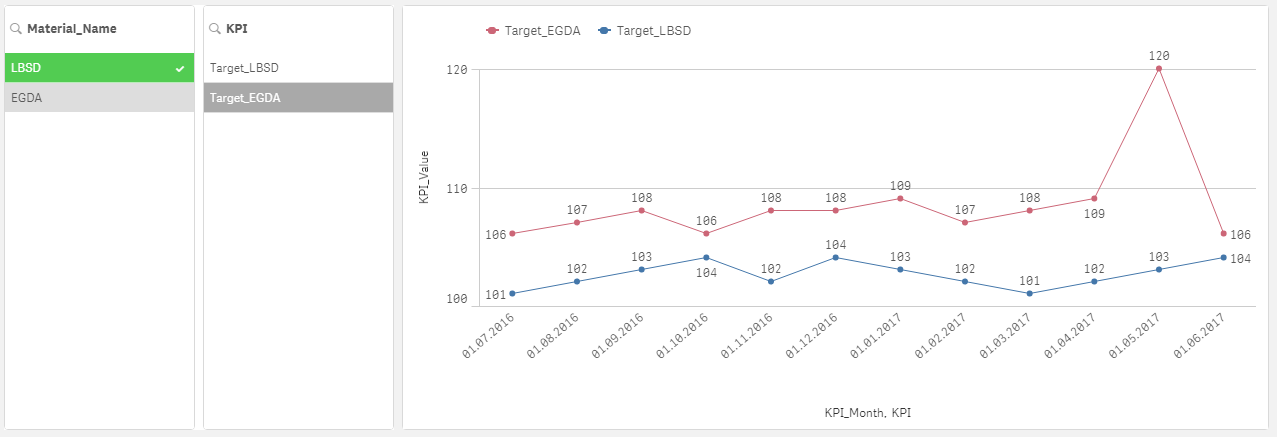
What I want is to select, e.g. LBSD and the chart to show me all values for Target_LBSD only.
- Mark as New
- Bookmark
- Subscribe
- Mute
- Subscribe to RSS Feed
- Permalink
- Report Inappropriate Content
Hi,
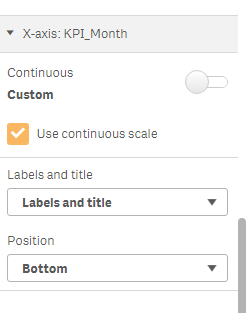
Mark the continuous scale in Xaxis in Appearance setting of the chart.
Please look at the image below.
- Mark as New
- Bookmark
- Subscribe
- Mute
- Subscribe to RSS Feed
- Permalink
- Report Inappropriate Content
The outcome is the same as before.
- Mark as New
- Bookmark
- Subscribe
- Mute
- Subscribe to RSS Feed
- Permalink
- Report Inappropriate Content
Hi
you use kpi_Month as dimension,
if month not exist you can't display it
use Month of your calendar as dimension
regards
- « Previous Replies
-
- 1
- 2
- Next Replies »