Unlock a world of possibilities! Login now and discover the exclusive benefits awaiting you.
- Qlik Community
- :
- Forums
- :
- Analytics
- :
- New to Qlik Analytics
- :
- Re: How to show new charts after every drill down?
Options
- Subscribe to RSS Feed
- Mark Topic as New
- Mark Topic as Read
- Float this Topic for Current User
- Bookmark
- Subscribe
- Mute
- Printer Friendly Page
Turn on suggestions
Auto-suggest helps you quickly narrow down your search results by suggesting possible matches as you type.
Showing results for
Creator
2018-01-11
03:51 AM
- Mark as New
- Bookmark
- Subscribe
- Mute
- Subscribe to RSS Feed
- Permalink
- Report Inappropriate Content
How to show new charts after every drill down?
Hi,
I want to represent my data by different charts (pie, bar, column etc). Lets say, at the time of loading bar chart should come, and then after 1 level of drill down, I want to show pie chart (1st level column chart should be hidden here) as so on.
I am expecting below layout:
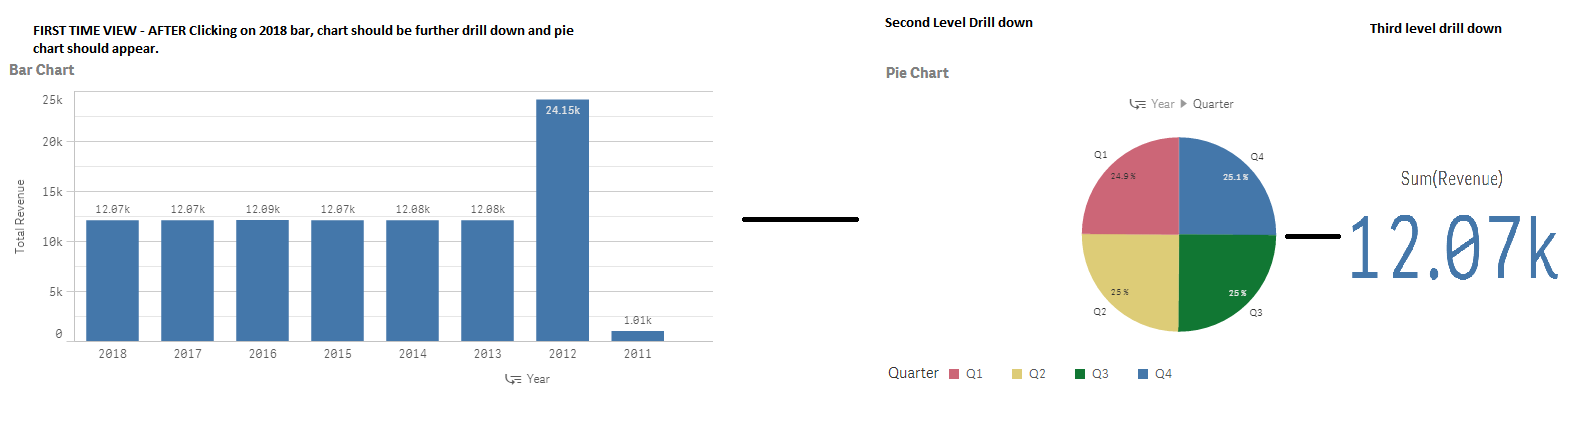
After every drill down, data representation should change.
Thanks
Dilip Solanki
Thanks
Dilip Solanki
Dilip Solanki
3,192 Views
- « Previous Replies
-
- 1
- 2
- Next Replies »
12 Replies
Creator
2018-01-11
05:45 AM
Author
- Mark as New
- Bookmark
- Subscribe
- Mute
- Subscribe to RSS Feed
- Permalink
- Report Inappropriate Content
Thanks Bill for your suggestions.
Thanks
Dilip Solanki
Dilip Solanki
258 Views
Creator
2018-01-11
05:45 AM
Author
- Mark as New
- Bookmark
- Subscribe
- Mute
- Subscribe to RSS Feed
- Permalink
- Report Inappropriate Content
Thanks Youssef for your suggestions.
Thanks
Dilip Solanki
Dilip Solanki
258 Views
MVP
2018-01-11
05:48 AM
- Mark as New
- Bookmark
- Subscribe
- Mute
- Subscribe to RSS Feed
- Permalink
- Report Inappropriate Content
that's unfortunately can't be done
But yu can personalize the message to add more value:
example:
Chart will be shown in 2nd drill down level...

258 Views
- « Previous Replies
-
- 1
- 2
- Next Replies »
Community Browser