Unlock a world of possibilities! Login now and discover the exclusive benefits awaiting you.
- Qlik Community
- :
- Forums
- :
- Analytics
- :
- New to Qlik Analytics
- :
- Re: How to show the part when i choose in the pie ...
- Subscribe to RSS Feed
- Mark Topic as New
- Mark Topic as Read
- Float this Topic for Current User
- Bookmark
- Subscribe
- Mute
- Printer Friendly Page
- Mark as New
- Bookmark
- Subscribe
- Mute
- Subscribe to RSS Feed
- Permalink
- Report Inappropriate Content
How to show the part when i choose in the pie chart while not 100%?
Hi,All
I thought that you have experienced the cucumstance in the pie chart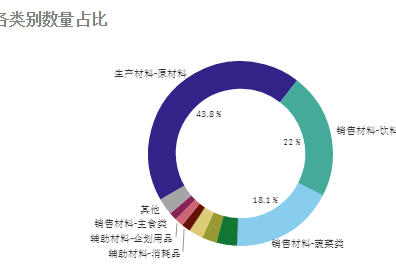
,
from the pie chart we know that 销售材料-饮料 is part values 22%.after I choose it ,it shows 100%,
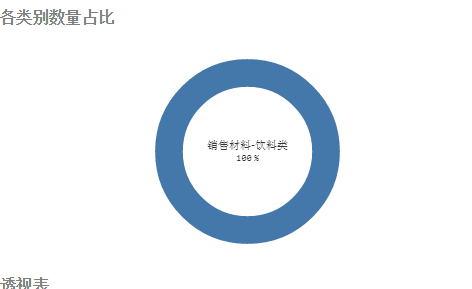
how to make it shows its original data?
Thanks !
- Tags:
- sense1.1
- Mark as New
- Bookmark
- Subscribe
- Mute
- Subscribe to RSS Feed
- Permalink
- Report Inappropriate Content
Change your expression from something like sum(Amount) to sum({<PartDimension=>}Amount). The {<PartDimension=>} will make the pie chart ignore selections in the PartDimension dimension. Use the real field names that apply in your situation.
talk is cheap, supply exceeds demand
- Mark as New
- Bookmark
- Subscribe
- Mute
- Subscribe to RSS Feed
- Permalink
- Report Inappropriate Content
Hi,
uncheck Relative in Expression's tab and change your expression from
sum(your_field)
to
Sum(your_field)*100/sum(all your_field)
but doing this youll lose % simbol on right side of your values.
Regards
MR
- Mark as New
- Bookmark
- Subscribe
- Mute
- Subscribe to RSS Feed
- Permalink
- Report Inappropriate Content
I texted.but it doesnot show as I wanted to be,I would like to express it detailed as follows.First statement.the left pie chart values classes,the right chart values name of materials,the left pie chart contains the right pie chart in level.
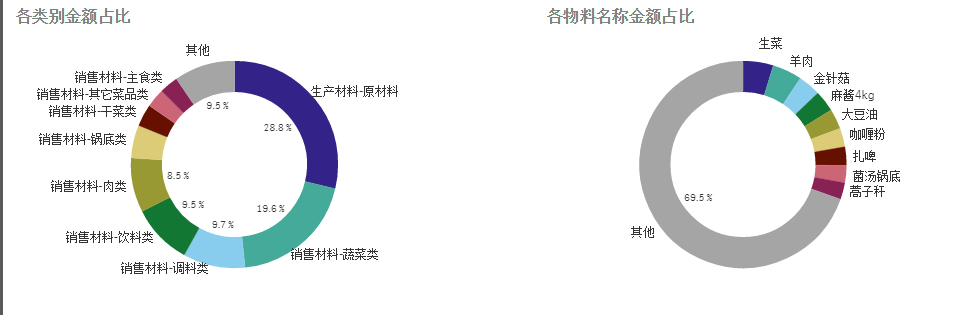
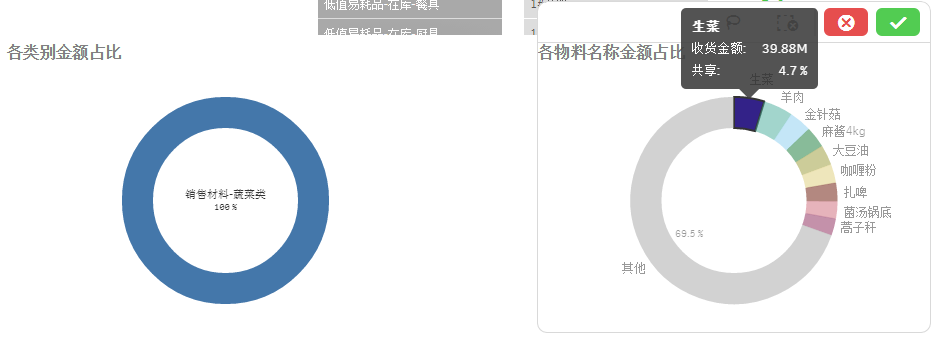
from the table we can see that 销售材料-蔬菜类 is 19.6% in the left pie chart ,when i click 生菜 in the right pie chart,the left pie chart show 100%,I want to let it show 19.6%,would it possible?
Thanks again
- Mark as New
- Bookmark
- Subscribe
- Mute
- Subscribe to RSS Feed
- Permalink
- Report Inappropriate Content
I texted ,but It doesnot show the difference compare with before
- Mark as New
- Bookmark
- Subscribe
- Mute
- Subscribe to RSS Feed
- Permalink
- Report Inappropriate Content
Share your qvw, please
- Mark as New
- Bookmark
- Subscribe
- Mute
- Subscribe to RSS Feed
- Permalink
- Report Inappropriate Content
Hi,
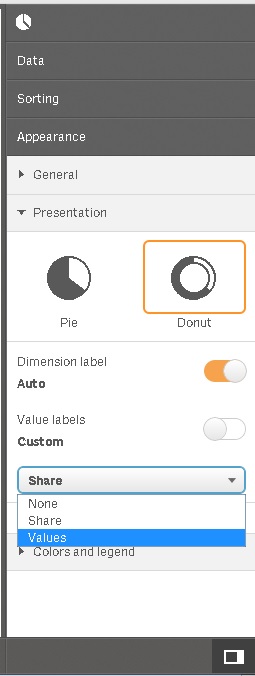
Following your first post I would suggest going to the obect's options: "Appearance" > "Presentation" > drop down menu - "Values".
However from the 2nd post I could suggest doing the same + creating a new "Drill-down" dimension, with the class of materials 1st and the names of materials as 2nd
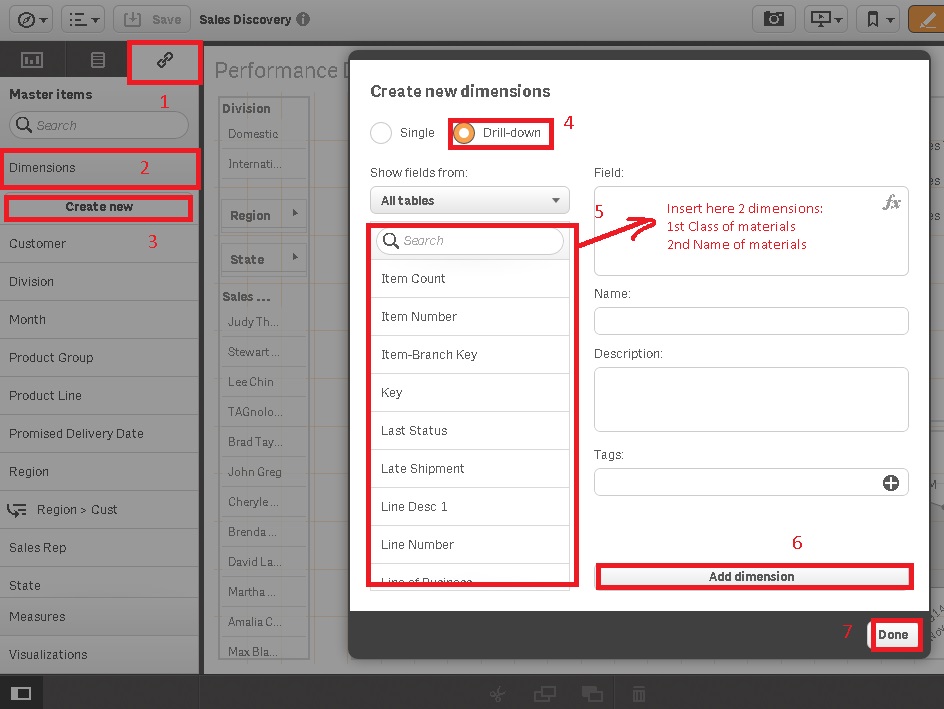 .
.
Maybe this could be helpful, but to get the best solution it is really probably best to upload the qvw of your project, cheers 