Unlock a world of possibilities! Login now and discover the exclusive benefits awaiting you.
- Qlik Community
- :
- Forums
- :
- Analytics
- :
- New to Qlik Analytics
- :
- How to show two different chart for same dimension...
- Subscribe to RSS Feed
- Mark Topic as New
- Mark Topic as Read
- Float this Topic for Current User
- Bookmark
- Subscribe
- Mute
- Printer Friendly Page
- Mark as New
- Bookmark
- Subscribe
- Mute
- Subscribe to RSS Feed
- Permalink
- Report Inappropriate Content
How to show two different chart for same dimension but different value?
Hi,
I have two dimension and one measures.First is Property field and second one is their Clients and the measure is Revenue.
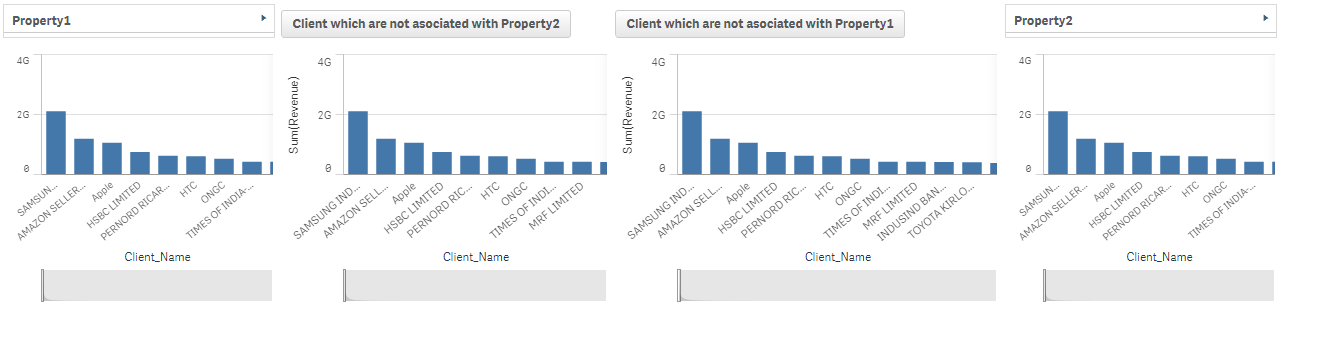
I want if I choose Property from Property1(like ABC) then my 1st bar chart give all the clients which are associated with that ABC property at the same time if I choose Property from Property2(like XYZ) then my 4th bar chart should give all the clients which are associated with XYZ Property and after that if I choose the button( Client which are not associated with Property2) then it gives all the clients which is in ABC property but not in XYZ Property and for do same thing for the other button vice versa..
Kindly help me out for this.
Thanks
Tanushree Roy