Unlock a world of possibilities! Login now and discover the exclusive benefits awaiting you.
- Qlik Community
- :
- Forums
- :
- Analytics
- :
- New to Qlik Analytics
- :
- Re: How to sum range of values
- Subscribe to RSS Feed
- Mark Topic as New
- Mark Topic as Read
- Float this Topic for Current User
- Bookmark
- Subscribe
- Mute
- Printer Friendly Page
- Mark as New
- Bookmark
- Subscribe
- Mute
- Subscribe to RSS Feed
- Permalink
- Report Inappropriate Content
How to sum range of values
Hi everybody,
I need your help with this issue:
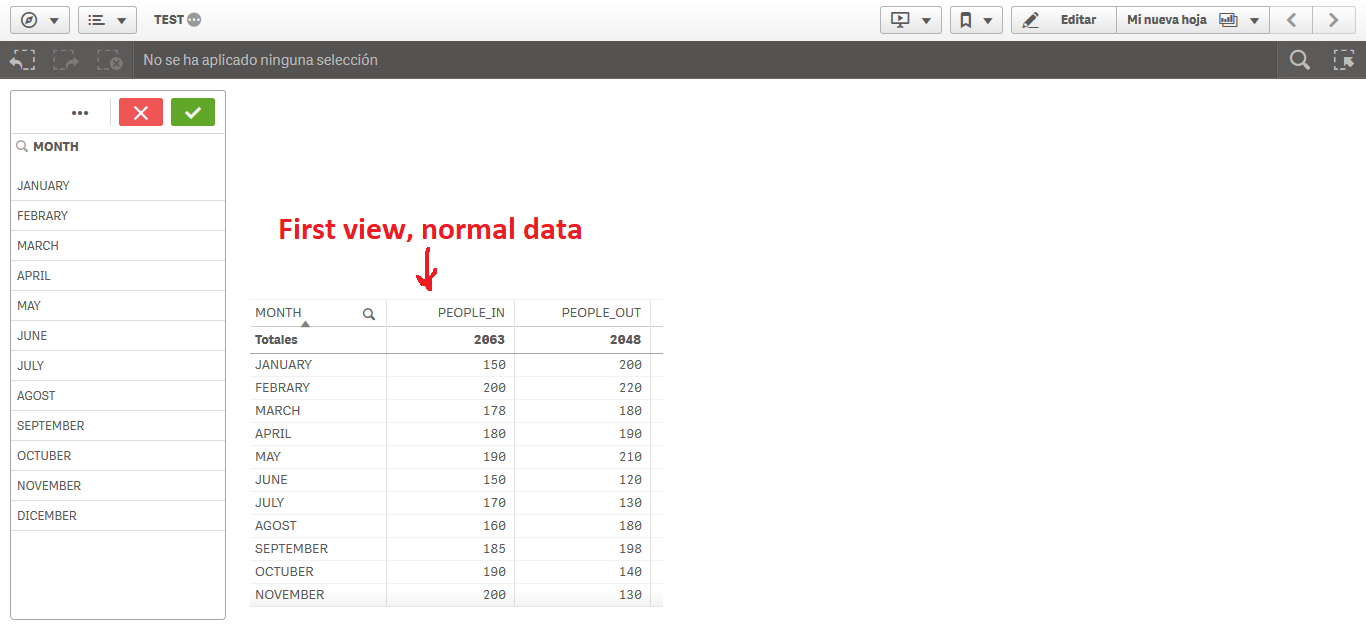
I just trying to consolidate the values from January to Month-N (N= someone month) as a filter, because I need to reflect the total in a pivot table. Let me give an example with this table:
MONTH= Dimension
PEOPLE_IN: Measure
PEOPLE_OUT: Measure
| MONTH | PEOPLE_IN | PEOPLE_OUT |
|---|---|---|
| JANUARY | 150 | 200 |
| FEBRARY | 200 | 220 |
| MARCH | 178 | 180 |
| APRIL | 180 | 190 |
| MAY | 190 | 210 |
| JUNE | 150 | 120 |
| JULY | 170 | 130 |
| AGOST | 160 | 180 |
| SEPTEMBER | 185 | 198 |
| OCTUBER | 190 | 140 |
| NOVEMBER | 200 | 130 |
| DICEMBER | 110 | 150 |
If I select January the table show it only the values from January, but if I select March the table should show me the total value from Jan to March (Jan+Feb+March) at the same time the filter should select all months back.
Filter: Jan
Select Jan
| MONTH | PEOPLE_IN | PEOPLE_OUT | |
|---|---|---|---|
| JANUARY | 150 | 200 |
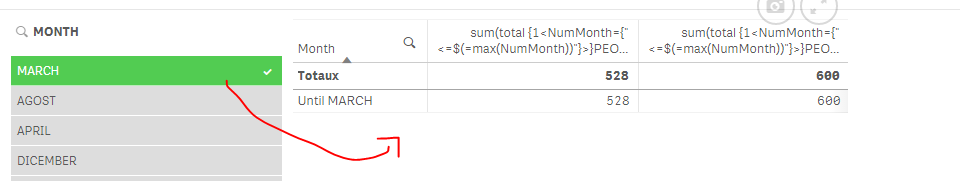
Filter: Jan+Feb+March
Select Jan to March
| MONTH | PEOPLE_IN | PEOPLE_OUT |
|---|---|---|
| JANUARY | 528 | 600 |
| FEBRARY | 528 | 600 |
| MARCH | 528 | 600 |
I believe that Sum(Total.....) might be a possible but really I don't know how used and how to do this.
I hope you can help me.
PD. Sorry if my english have some mistakes...
- « Previous Replies
-
- 1
- 2
- Next Replies »
- Mark as New
- Bookmark
- Subscribe
- Mute
- Subscribe to RSS Feed
- Permalink
- Report Inappropriate Content
Hi Umar,
No, it isn't. I'm really expecting something like this:
| MONTH | PEOPLE_IN | PEOPLE_OUT |
|---|---|---|
| MARCH | 528 | 600 |
If I select March, the sum should be reflect the total (Jan+Feb+March) in PEOPLE_IN and PEOPLE_OUT
- Mark as New
- Bookmark
- Subscribe
- Mute
- Subscribe to RSS Feed
- Permalink
- Report Inappropriate Content
I believe what you want can be achieved with an AsOf table approach, as described by HIC in the blog post I've posted in my last answer.
It basically creates a new field AsOfMonth, that links each month value to all previous months values, e.g. March to March, February, January. Use this field as dimension in your table chart.
- Mark as New
- Bookmark
- Subscribe
- Mute
- Subscribe to RSS Feed
- Permalink
- Report Inappropriate Content
Have u tried my solution?
That's exactly what's it's giving back 
- Mark as New
- Bookmark
- Subscribe
- Mute
- Subscribe to RSS Feed
- Permalink
- Report Inappropriate Content
- Mark as New
- Bookmark
- Subscribe
- Mute
- Subscribe to RSS Feed
- Permalink
- Report Inappropriate Content
Hi omarbensalem,
It's true, your solution really works, but I don´t want to sum all values from the begining. I mean, I want some like this
The table should show the data in "normal state"
After, when the filter is apply, it should show the sum of the values from Jan to Month selected:
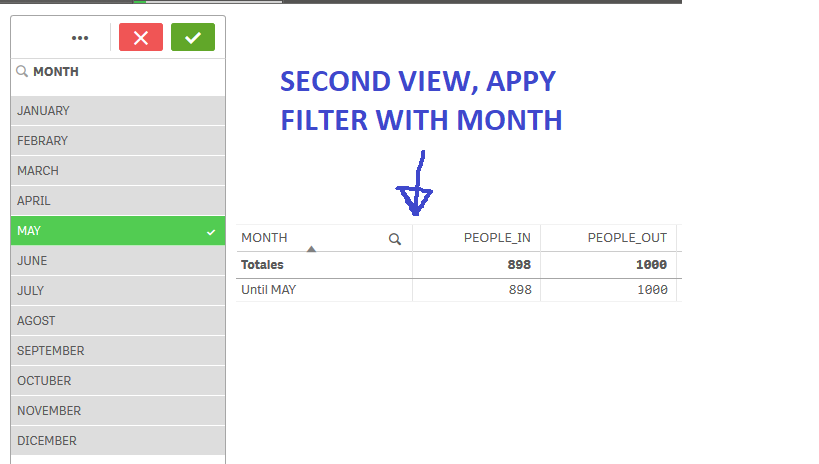
Is it possible??
- Mark as New
- Bookmark
- Subscribe
- Mute
- Subscribe to RSS Feed
- Permalink
- Report Inappropriate Content
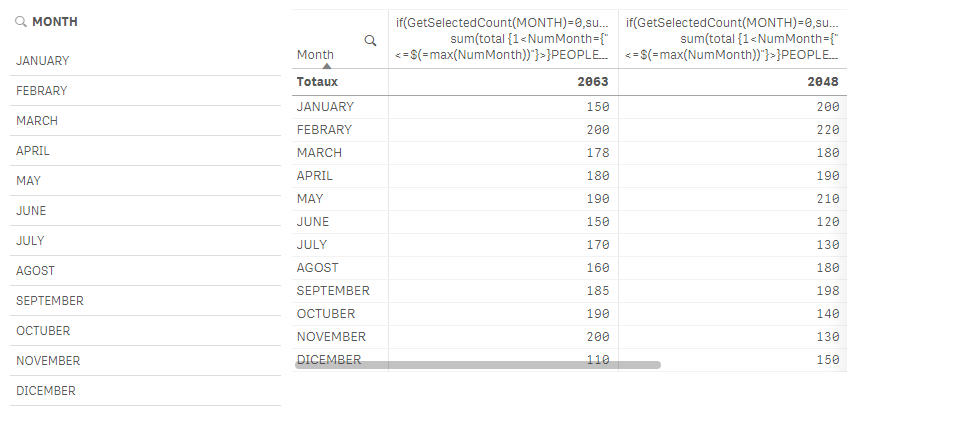
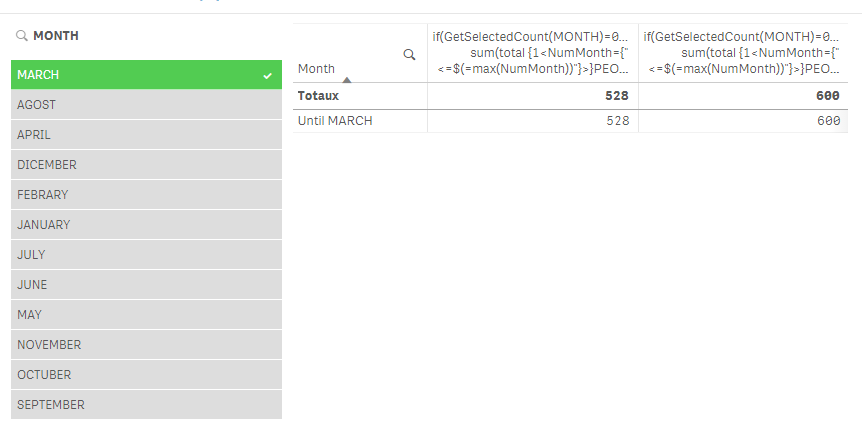
then change the expression as follow:
if(GetSelectedCount(MONTH)=0,sum(PEOPLE_IN), sum(total {1<NumMonth={"<=$(=max(NumMonth))"}>}PEOPLE_IN))
if(GetSelectedCount(MONTH)=0,sum(PEOPLE_OUT), sum(total {1<NumMonth={"<=$(=max(NumMonth))"}>}PEOPLE_OUT))
- Mark as New
- Bookmark
- Subscribe
- Mute
- Subscribe to RSS Feed
- Permalink
- Report Inappropriate Content
- « Previous Replies
-
- 1
- 2
- Next Replies »