Unlock a world of possibilities! Login now and discover the exclusive benefits awaiting you.
- Qlik Community
- :
- Forums
- :
- Analytics
- :
- New to Qlik Analytics
- :
- How to sum up the values in a period of time and s...
- Subscribe to RSS Feed
- Mark Topic as New
- Mark Topic as Read
- Float this Topic for Current User
- Bookmark
- Subscribe
- Mute
- Printer Friendly Page
- Mark as New
- Bookmark
- Subscribe
- Mute
- Subscribe to RSS Feed
- Permalink
- Report Inappropriate Content
How to sum up the values in a period of time and show the evolution in graph?
Hi guys, hope you are in a tip-top shape 
I have problem with summing up the values and showing them in the graph. i want to sum up day by day ( for example showing a value for today as the start point, for tomorrow it should be the summation of today's value and tomorrow's value , and for the third day it should be the summation of the first two days plus the third day so on, so the trends must be increasing ).
the graph has 3 parameters , 2 parameter for the X axis and the value for the Y axis.
in the X axis one of the parameters is date and the other one is the materials which owns the values. the filed for the material is called Tipo which shows the Type of materials (F&L).
would you please help me how to do this summation? for different type 
The screenshot is attached. 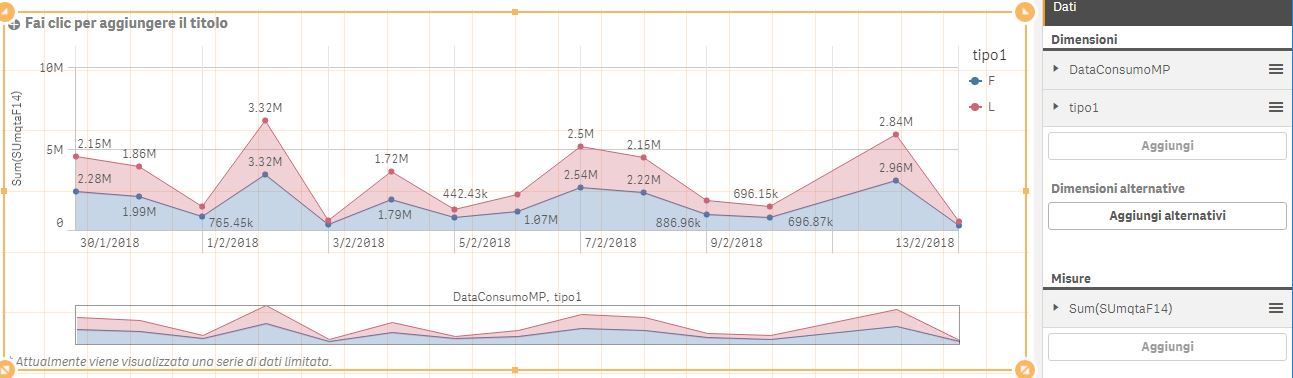
Accepted Solutions
- Mark as New
- Bookmark
- Subscribe
- Mute
- Subscribe to RSS Feed
- Permalink
- Report Inappropriate Content
Hi,
you need to user RangeSum() function with above () function.
Read this:
- Mark as New
- Bookmark
- Subscribe
- Mute
- Subscribe to RSS Feed
- Permalink
- Report Inappropriate Content
Hi,
you need to user RangeSum() function with above () function.
Read this: