Unlock a world of possibilities! Login now and discover the exclusive benefits awaiting you.
- Qlik Community
- :
- Forums
- :
- Analytics
- :
- New to Qlik Analytics
- :
- How to use sum in pie chart?
- Subscribe to RSS Feed
- Mark Topic as New
- Mark Topic as Read
- Float this Topic for Current User
- Bookmark
- Subscribe
- Mute
- Printer Friendly Page
- Mark as New
- Bookmark
- Subscribe
- Mute
- Subscribe to RSS Feed
- Permalink
- Report Inappropriate Content
How to use sum in pie chart?
Good day,
I would really appreciate if someone could help me with pie charts
We have a table which contains sales info per manager and looks like this:
| Date | Manager 1 | Manager 2 |
|---|---|---|
| 23.02.2017 | 11500 | 7000 |
| 24.02.2017 | 0 | 2000 |
| 25.02.2017 | 3500 | 700 |
| 26.02.2017 | 0 | 10000 |
| 27.02.2017 | 5000 | 0 |
| etc |
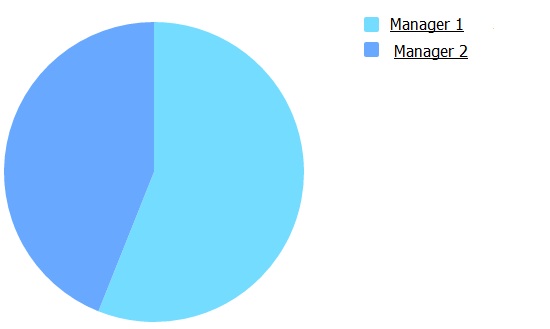
I need to make a pie chart that shows sum of sales per manager.
How can I do it in Qlik Sense?
- Mark as New
- Bookmark
- Subscribe
- Mute
- Subscribe to RSS Feed
- Permalink
- Report Inappropriate Content
Change your origin table in the script as follow:
crosstable(Managers, Sales)
load
*
from your source :
With that you'll have a new field called Managers which contains manager1 and manager 2, and a new field called sales:
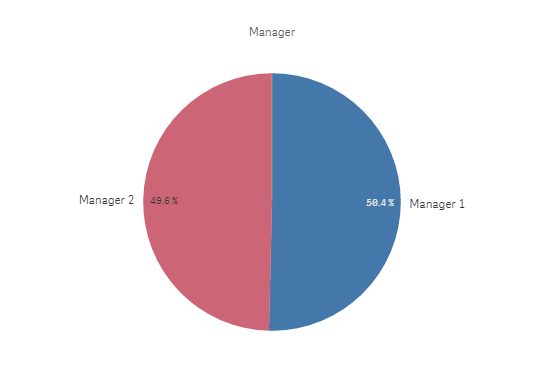
In your pie chart, you just choose as dimension: Manager and as a measure: sum(Sales)
- Mark as New
- Bookmark
- Subscribe
- Mute
- Subscribe to RSS Feed
- Permalink
- Report Inappropriate Content
Hi ,
You can achieve this by using Crosstab option. Please find attached qvf.
Thanks,
Gnaesh
- Mark as New
- Bookmark
- Subscribe
- Mute
- Subscribe to RSS Feed
- Permalink
- Report Inappropriate Content
I couldn't figure out how to use crosstable. Despite familiarizing with QlikView Manual.
But still I understood that I need to change source table
So I moved from
DATE | MANAGER 1 | MANAGER 2
to
SALE No. | MANAGER | SALE DATE | COST
and then I used Manager as a dimension and Sum(Cost) as measure. That did the trick
Thank you.
- Mark as New
- Bookmark
- Subscribe
- Mute
- Subscribe to RSS Feed
- Permalink
- Report Inappropriate Content
Thank you for the reply.
I couldn't sort out how to use crosstable, so I've changed my source table