Unlock a world of possibilities! Login now and discover the exclusive benefits awaiting you.
- Qlik Community
- :
- Forums
- :
- Analytics
- :
- New to Qlik Analytics
- :
- Re: Increase percentage in pivot tables
- Subscribe to RSS Feed
- Mark Topic as New
- Mark Topic as Read
- Float this Topic for Current User
- Bookmark
- Subscribe
- Mute
- Printer Friendly Page
- Mark as New
- Bookmark
- Subscribe
- Mute
- Subscribe to RSS Feed
- Permalink
- Report Inappropriate Content
Increase percentage in pivot tables
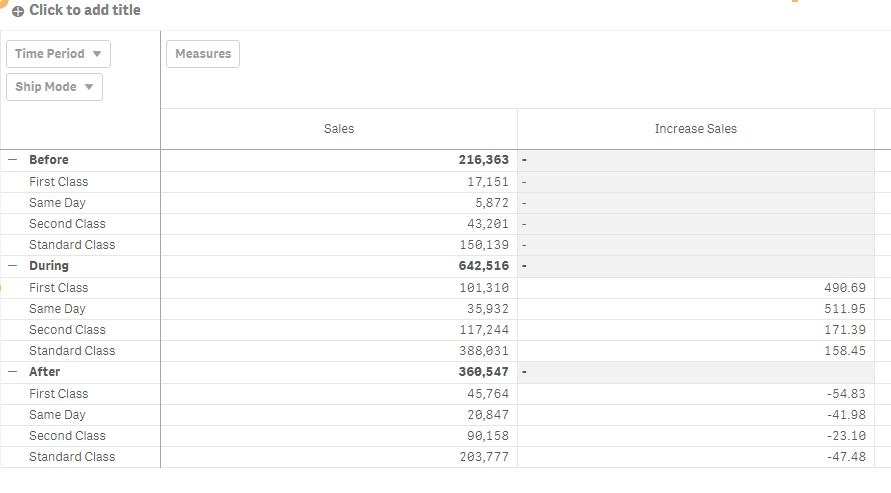
What I am trying to do is the following: I have a pivot table where as Rows I have a calculated categorical field based on 3 date intervals called Time Period (6 dates are specified through Variable Extension boxes to calculate Time Period), and another categorical variable called Ship Mode. As Columns I have Measures, and this Measures are specifically: Sales, and Profits. The look of my Pivot Table is the following:

What I would like to do is to create 2 columns called "Increase Sales" and "Increase Profits" where I could calculate percentage increases of sales and profits, but adapted automatically to the dates that the user enters via "Variable Extension" boxes. The logic of the percentage increases would be:
Before = [(Before-After) / After] x 100
During = [(During-Before) / Beforel] x 100
After = [(After-During) / During] x 100
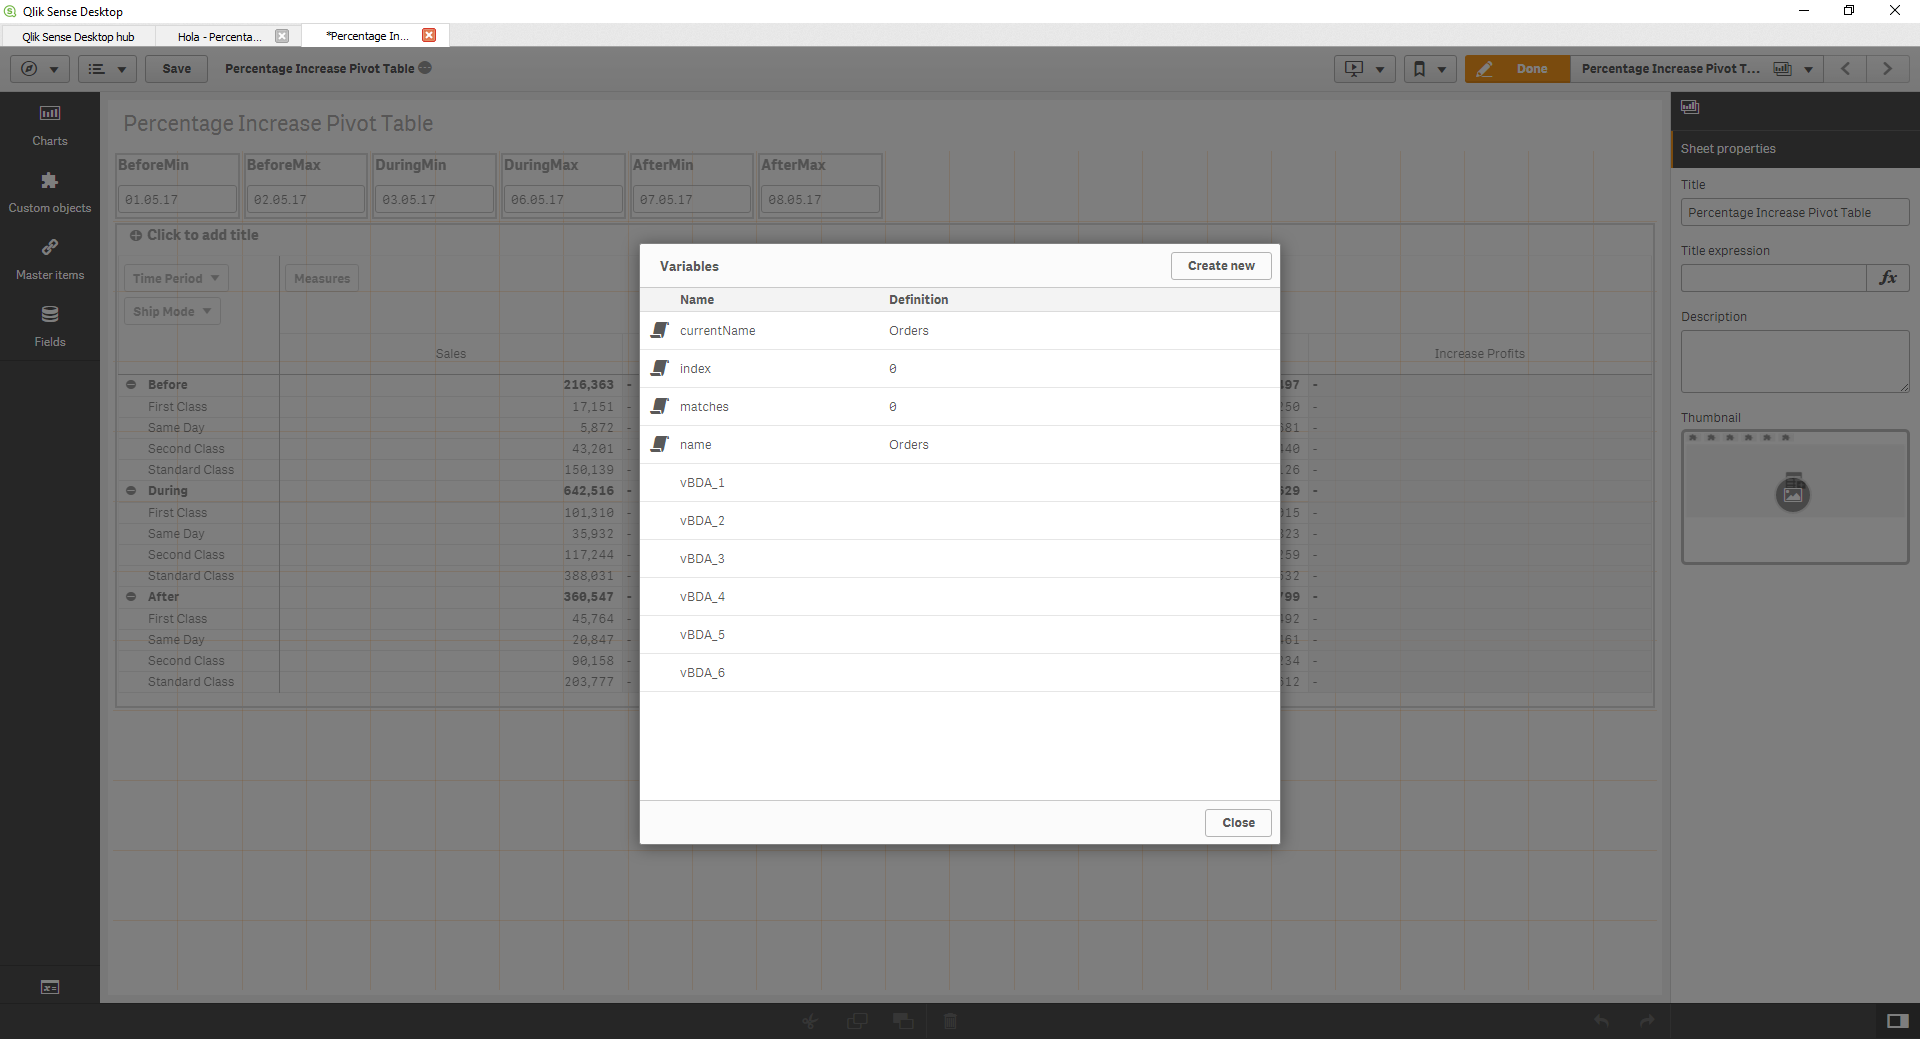
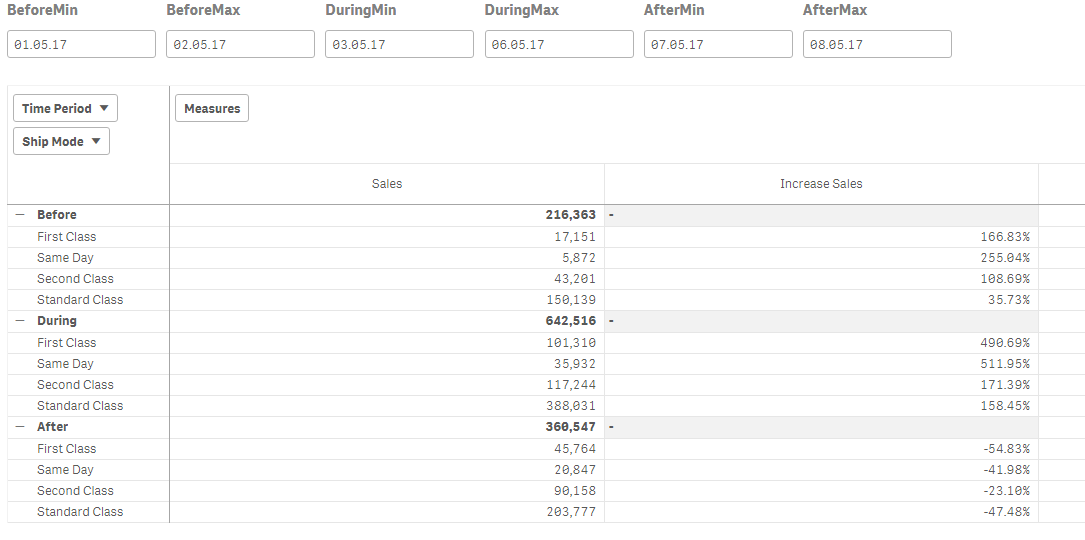
To reproduce my example in the App I provide as attached file, the dates the user must enter via Variable Extension would be (picture below):
BeforeMin = 01.05.17
BeforeMax = 02.05.17
DuringMin = 03.05.17
DuringMax = 06.05.17
AfterMin = 07.05.17
AfterMax = 08.05.17
And the result of the desired pivot table look would be for the first column (Increase Sales):

I attach a Qlik file 100% reproducible for this question. Thanks in advance for any help Community. Anibal
- Tags:
- pivot table increase
- « Previous Replies
-
- 1
- 2
- Next Replies »
Accepted Solutions
- Mark as New
- Bookmark
- Subscribe
- Mute
- Subscribe to RSS Feed
- Permalink
- Report Inappropriate Content
- Mark as New
- Bookmark
- Subscribe
- Mute
- Subscribe to RSS Feed
- Permalink
- Report Inappropriate Content
What is Final in your expression? I only see Before, During, and After
- Mark as New
- Bookmark
- Subscribe
- Mute
- Subscribe to RSS Feed
- Permalink
- Report Inappropriate Content
Hi Sunny,
Thank you for your message.
"Final" was wrong. The correct is "After". I have already edited the question thanks to your feedback. Anibal
- Mark as New
- Bookmark
- Subscribe
- Mute
- Subscribe to RSS Feed
- Permalink
- Report Inappropriate Content
One more thing, I don't have the extension, but I added the dates from the variable overview... but for some reason Before isn't showing up... would you know why that might be the case, what might I be missing here?

- Mark as New
- Bookmark
- Subscribe
- Mute
- Subscribe to RSS Feed
- Permalink
- Report Inappropriate Content
Hi Sunny,
After doing several tests, I believe that the only way of visualizing it correctly is with the add-on. Nevertheless for the purposes of the pivot table question, maybe just knowing how to do it assigning it through the Variable Editor will do the trick.
I attach the add-on that I have installed. It should be unzipped and located in: "C:\Users\user\Documents\Qlik\Sense\Extensions" in Windows OS.
With Variable Extension you manually write the dates in the boxes, but it does not affect the values of the variables in the Variable Editor as shown here:
Thanks in advace, Anibal
- Mark as New
- Bookmark
- Subscribe
- Mute
- Subscribe to RSS Feed
- Permalink
- Report Inappropriate Content
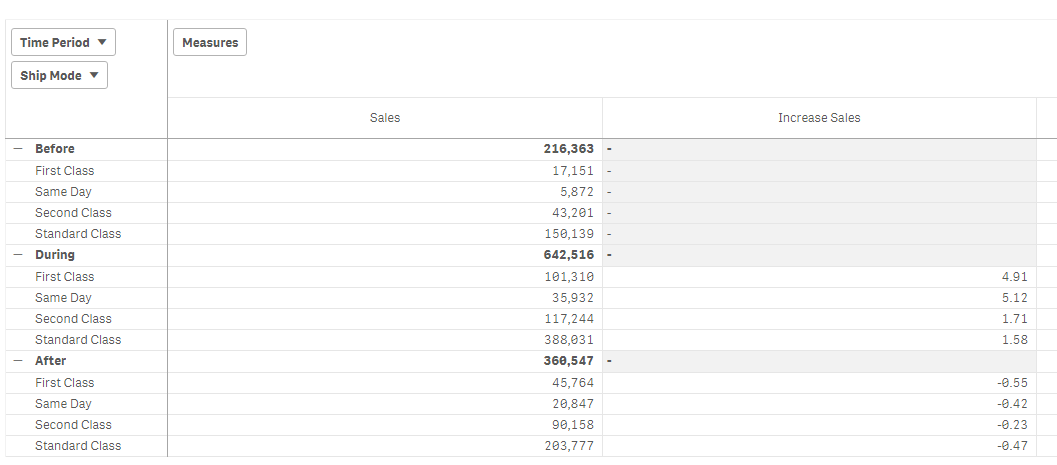
So, the extension worked for me. Now, I see the issue that you might be running into, but before I proceed forward, it seems that either the calculation for During is not right, or the After is not right.
Is this right
or this?
- Mark as New
- Bookmark
- Subscribe
- Mute
- Subscribe to RSS Feed
- Permalink
- Report Inappropriate Content
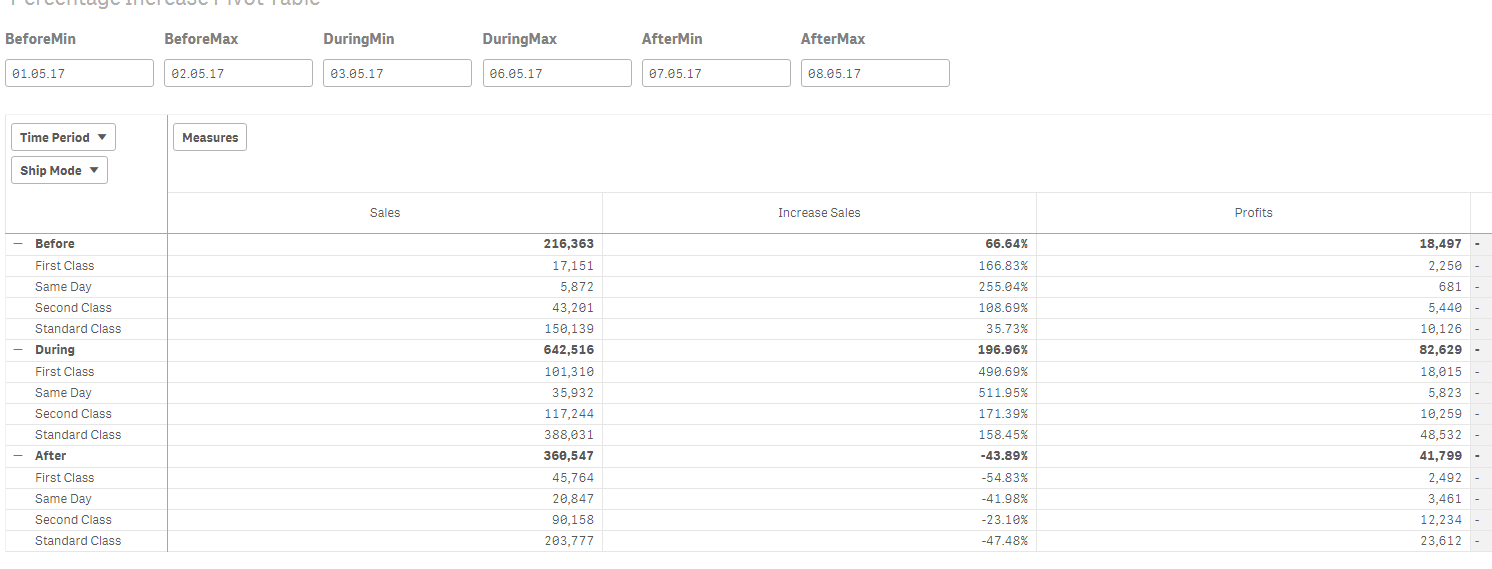
Hi Sunny, the answer would be: the first image that you posted.
The correct values for the dates that you introduced in your variable extension boxes would be the next ones:
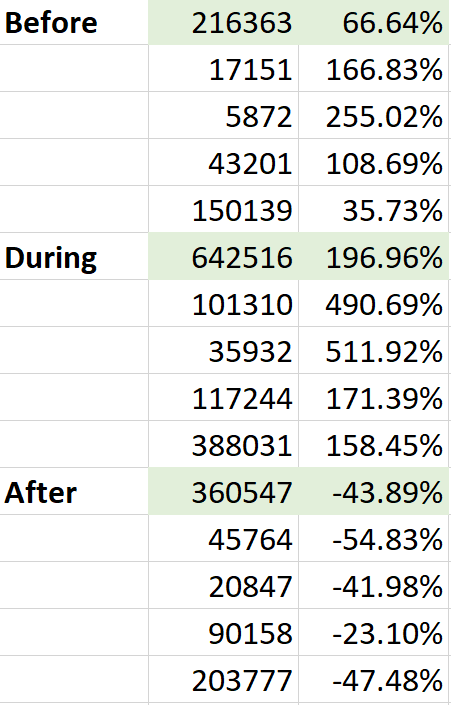
P.D. I have realized another mistake. In my example I put month "05", but with data from month "03". Now the question matches your results perfectly. Thanks a lot in advance. Anibal
- Mark as New
- Bookmark
- Subscribe
- Mute
- Subscribe to RSS Feed
- Permalink
- Report Inappropriate Content
I have managed to get this far
If(RowNo(TOTAL) <= 4,
(Sum(TOTAL <[Ship Mode]> Aggr(If(Date >= Date#('$(vBDA_5)','DD.MM.YY') and Date <= Date#('$(vBDA_6)','DD.MM.YY'), Sum(Sales)), [Ship Mode], Date)) - Sum(Sales))
/Sum(Sales),
If(RowNo(TOTAL) <= 8,
(Sum(Sales) - Sum(TOTAL <[Ship Mode]> Aggr(If(Date >= Date#('$(vBDA_1)','DD.MM.YY') and Date <= Date#('$(vBDA_2)','DD.MM.YY'), Sum(Sales)), [Ship Mode], Date)))
/Sum(TOTAL <[Ship Mode]> Aggr(If(Date >= Date#('$(vBDA_1)','DD.MM.YY') and Date <= Date#('$(vBDA_2)','DD.MM.YY'), Sum(Sales)), [Ship Mode], Date)),
If(RowNo(TOTAL) <= 12,
(Sum(Sales) - Sum(TOTAL <[Ship Mode]> Aggr(If(Date >= Date#('$(vBDA_3)','DD.MM.YY') and Date <= Date#('$(vBDA_4)','DD.MM.YY'), Sum(Sales)), [Ship Mode], Date)))
/Sum(TOTAL <[Ship Mode]> Aggr(If(Date >= Date#('$(vBDA_3)','DD.MM.YY') and Date <= Date#('$(vBDA_4)','DD.MM.YY'), Sum(Sales)), [Ship Mode], Date)))))
Will try to get the totals to work....
- Mark as New
- Bookmark
- Subscribe
- Mute
- Subscribe to RSS Feed
- Permalink
- Report Inappropriate Content
This seems to work
If(MaxString(Date) = Date#('$(vBDA_2)','DD.MM.YY'),
(Sum(TOTAL <[Ship Mode]> Aggr(If(Date >= Date#('$(vBDA_5)','DD.MM.YY') and Date <= Date#('$(vBDA_6)','DD.MM.YY'), Sum(Sales)), [Ship Mode], Date)) - Sum(Sales))
/Sum(Sales),
If(MaxString(Date) = Date#('$(vBDA_4)','DD.MM.YY'),
(Sum(Sales) - Sum(TOTAL <[Ship Mode]> Aggr(If(Date >= Date#('$(vBDA_1)','DD.MM.YY') and Date <= Date#('$(vBDA_2)','DD.MM.YY'), Sum(Sales)), [Ship Mode], Date)))
/Sum(TOTAL <[Ship Mode]> Aggr(If(Date >= Date#('$(vBDA_1)','DD.MM.YY') and Date <= Date#('$(vBDA_2)','DD.MM.YY'), Sum(Sales)), [Ship Mode], Date)),
If(MaxString(Date) = Date#('$(vBDA_6)','DD.MM.YY'),
(Sum(Sales) - Sum(TOTAL <[Ship Mode]> Aggr(If(Date >= Date#('$(vBDA_3)','DD.MM.YY') and Date <= Date#('$(vBDA_4)','DD.MM.YY'), Sum(Sales)), [Ship Mode], Date)))
/Sum(TOTAL <[Ship Mode]> Aggr(If(Date >= Date#('$(vBDA_3)','DD.MM.YY') and Date <= Date#('$(vBDA_4)','DD.MM.YY'), Sum(Sales)), [Ship Mode], Date)))))
- Mark as New
- Bookmark
- Subscribe
- Mute
- Subscribe to RSS Feed
- Permalink
- Report Inappropriate Content
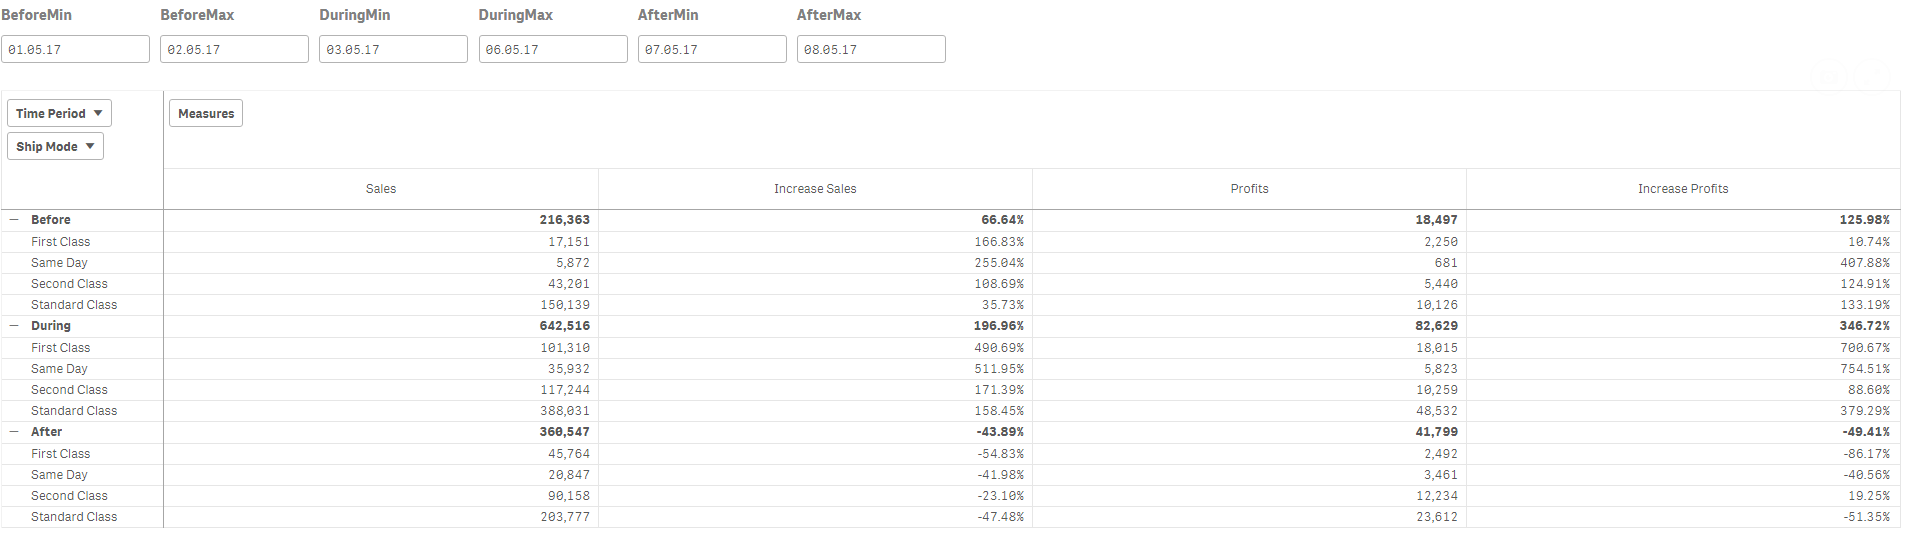
Added Profit also
- « Previous Replies
-
- 1
- 2
- Next Replies »