Unlock a world of possibilities! Login now and discover the exclusive benefits awaiting you.
- Qlik Community
- :
- Forums
- :
- Analytics
- :
- New to Qlik Analytics
- :
- Re: Is it possible to group dimensions by an expre...
- Subscribe to RSS Feed
- Mark Topic as New
- Mark Topic as Read
- Float this Topic for Current User
- Bookmark
- Subscribe
- Mute
- Printer Friendly Page
- Mark as New
- Bookmark
- Subscribe
- Mute
- Subscribe to RSS Feed
- Permalink
- Report Inappropriate Content
Is it possible to group dimensions by an expression rather than expressions by a dimension in a bar chart?
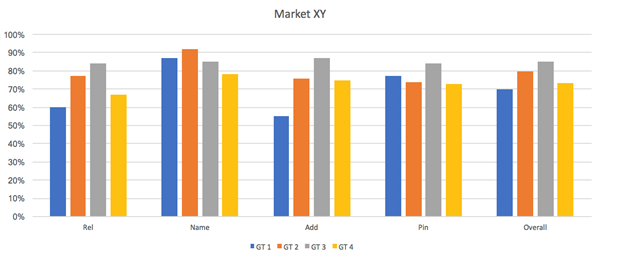
In the image above GT1 GTT2 etc are the dimensions and Rel, Name, Add, Pin, Overall are the names of the expresisons used.
Is this possible in Qlik Sense?
Thanks,
Joseph
Accepted Solutions
- Mark as New
- Bookmark
- Subscribe
- Mute
- Subscribe to RSS Feed
- Permalink
- Report Inappropriate Content
You should be able to use synthetic dimensions using Valuelist().
Something like this as first dimension
=Valuelist('Rel','Name')
Second dimension your GTs.
Then one expression branching into the relevant execution pass:
=Pick(Match(Valuelist('Rel','Name'),'Rel','Name')),
Sum(Rel), //replace with Rel code
Count(Name) // replace with Name code
)
- Mark as New
- Bookmark
- Subscribe
- Mute
- Subscribe to RSS Feed
- Permalink
- Report Inappropriate Content
Hi Joseph,
can you share a sample data ?
Br,
KC
KC
- Mark as New
- Bookmark
- Subscribe
- Mute
- Subscribe to RSS Feed
- Permalink
- Report Inappropriate Content
You should be able to use synthetic dimensions using Valuelist().
Something like this as first dimension
=Valuelist('Rel','Name')
Second dimension your GTs.
Then one expression branching into the relevant execution pass:
=Pick(Match(Valuelist('Rel','Name'),'Rel','Name')),
Sum(Rel), //replace with Rel code
Count(Name) // replace with Name code
)
- Mark as New
- Bookmark
- Subscribe
- Mute
- Subscribe to RSS Feed
- Permalink
- Report Inappropriate Content
I can’t unfortunately, but the requirement should be the same with any data set and expressions. I need to show the expressions on the x-axis and the dimensions in the legend.
- Mark as New
- Bookmark
- Subscribe
- Mute
- Subscribe to RSS Feed
- Permalink
- Report Inappropriate Content
Thanks, I willgive it a try.
- Mark as New
- Bookmark
- Subscribe
- Mute
- Subscribe to RSS Feed
- Permalink
- Report Inappropriate Content
here is a sample attached, used the same logic suggested by stefan 
Br,
KC
KC
- Mark as New
- Bookmark
- Subscribe
- Mute
- Subscribe to RSS Feed
- Permalink
- Report Inappropriate Content
That works great thanks!