Unlock a world of possibilities! Login now and discover the exclusive benefits awaiting you.
- Qlik Community
- :
- Forums
- :
- Analytics
- :
- New to Qlik Analytics
- :
- Re: Is the 2 dimension line chart limited only to ...
- Subscribe to RSS Feed
- Mark Topic as New
- Mark Topic as Read
- Float this Topic for Current User
- Bookmark
- Subscribe
- Mute
- Printer Friendly Page
- Mark as New
- Bookmark
- Subscribe
- Mute
- Subscribe to RSS Feed
- Permalink
- Report Inappropriate Content
Is the 2 dimension line chart limited only to 12 values?
Hi All,
So I created a 2 dimension line chart. My 2nd dimension have more than 20values.. but in the report it is showing only up to 12.
Is this a limitation?
Thanks,
Lyn
- « Previous Replies
-
- 1
- 2
- Next Replies »
- Mark as New
- Bookmark
- Subscribe
- Mute
- Subscribe to RSS Feed
- Permalink
- Report Inappropriate Content
hi, i have attached the qvf file in my reply to Avinash
- Mark as New
- Bookmark
- Subscribe
- Mute
- Subscribe to RSS Feed
- Permalink
- Report Inappropriate Content
Hi donatdonat,
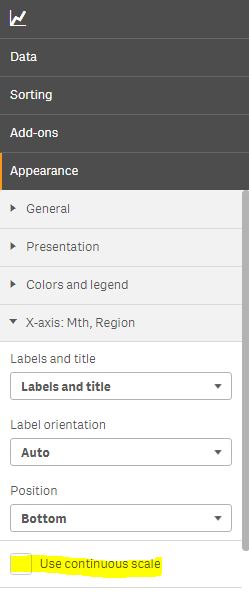
Uncheck "Use continuous scale"
- Mark as New
- Bookmark
- Subscribe
- Mute
- Subscribe to RSS Feed
- Permalink
- Report Inappropriate Content
Interesting.. unfortunately the user wants to show the continuous scale
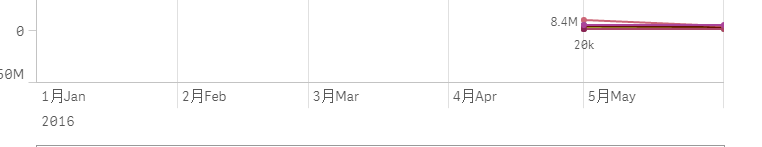
As you can see if I uncheck, it will look like this
And user cannot zoom into dates anymore...
- Mark as New
- Bookmark
- Subscribe
- Mute
- Subscribe to RSS Feed
- Permalink
- Report Inappropriate Content
Is it a Sense application?
I think you should have posted into Sense area 
- Mark as New
- Bookmark
- Subscribe
- Mute
- Subscribe to RSS Feed
- Permalink
- Report Inappropriate Content
oh yea.. i thought this was the sense area..!
- Mark as New
- Bookmark
- Subscribe
- Mute
- Subscribe to RSS Feed
- Permalink
- Report Inappropriate Content
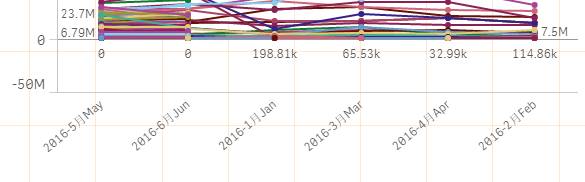
Hi .. I can see upto 16 regions from the attached app screen shot attached below I don't see any limitation.. what is the question please..

thanks
- Mark as New
- Bookmark
- Subscribe
- Mute
- Subscribe to RSS Feed
- Permalink
- Report Inappropriate Content
try to use the autocalendar script and use the fields generated from there
- « Previous Replies
-
- 1
- 2
- Next Replies »