Unlock a world of possibilities! Login now and discover the exclusive benefits awaiting you.
- Qlik Community
- :
- Forums
- :
- Analytics
- :
- New to Qlik Analytics
- :
- Item and Series Item
- Subscribe to RSS Feed
- Mark Topic as New
- Mark Topic as Read
- Float this Topic for Current User
- Bookmark
- Subscribe
- Mute
- Printer Friendly Page
- Mark as New
- Bookmark
- Subscribe
- Mute
- Subscribe to RSS Feed
- Permalink
- Report Inappropriate Content
Item and Series Item
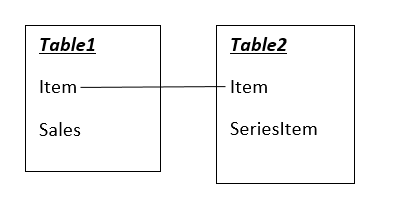
Here is part of my data model: Table1 has field Item and Sales , Table2 has field Item and SeriesItem, which represents items within the same series.
In the layout, I have a table chart with fields SeriesItem and Sales. Here's my question: if I select an Item, I want the table show Sales for SeriesItem.
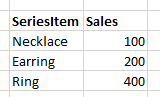
For example, Here's the data in my model:

So, when selecting Necklace, I want to see in my table chart:
Now in the table chart, I'm using SeriesItem as dimension, Sum({<Item={"$(=SeriesItem)"}>}Sales) as measure. But measure is only valid when one SeriesItem is selected.
How should I modify my function? Any advice helps! Thank you in advance!!
Accepted Solutions
- Mark as New
- Bookmark
- Subscribe
- Mute
- Subscribe to RSS Feed
- Permalink
- Report Inappropriate Content
I think your current model is incorrect. You should fix it instead of mitigating the symptoms. Item in Table 1 cleary means something else then Item in Table 2. That means the Item fields should not have the same name, because if they are then you're telling Qlik Sense that they are the same, which they're not.
talk is cheap, supply exceeds demand
- Mark as New
- Bookmark
- Subscribe
- Mute
- Subscribe to RSS Feed
- Permalink
- Report Inappropriate Content
Rename Item in Table1 to SeriesItem.
talk is cheap, supply exceeds demand
- Mark as New
- Bookmark
- Subscribe
- Mute
- Subscribe to RSS Feed
- Permalink
- Report Inappropriate Content
It has the association so just write Sum(Sales)
it will show the sales value which you selected item.
Regards,
Gopi
- Mark as New
- Bookmark
- Subscribe
- Mute
- Subscribe to RSS Feed
- Permalink
- Report Inappropriate Content
Hi Gysbert, thanks for helping, but this is only a part of the original model, renaming will destroy the whole model. Is there a way to do this only in chart expression?
- Mark as New
- Bookmark
- Subscribe
- Mute
- Subscribe to RSS Feed
- Permalink
- Report Inappropriate Content
Hi Gopi, thanks for helping. But in this case, it can only show sales for Necklace, which is 100.

- Mark as New
- Bookmark
- Subscribe
- Mute
- Subscribe to RSS Feed
- Permalink
- Report Inappropriate Content
I think your current model is incorrect. You should fix it instead of mitigating the symptoms. Item in Table 1 cleary means something else then Item in Table 2. That means the Item fields should not have the same name, because if they are then you're telling Qlik Sense that they are the same, which they're not.
talk is cheap, supply exceeds demand