Unlock a world of possibilities! Login now and discover the exclusive benefits awaiting you.
- Qlik Community
- :
- Forums
- :
- Analytics
- :
- New to Qlik Analytics
- :
- Re: KPI to return value of cell in excel spreadshe...
- Subscribe to RSS Feed
- Mark Topic as New
- Mark Topic as Read
- Float this Topic for Current User
- Bookmark
- Subscribe
- Mute
- Printer Friendly Page
- Mark as New
- Bookmark
- Subscribe
- Mute
- Subscribe to RSS Feed
- Permalink
- Report Inappropriate Content
KPI to return value of cell in excel spreadsheet
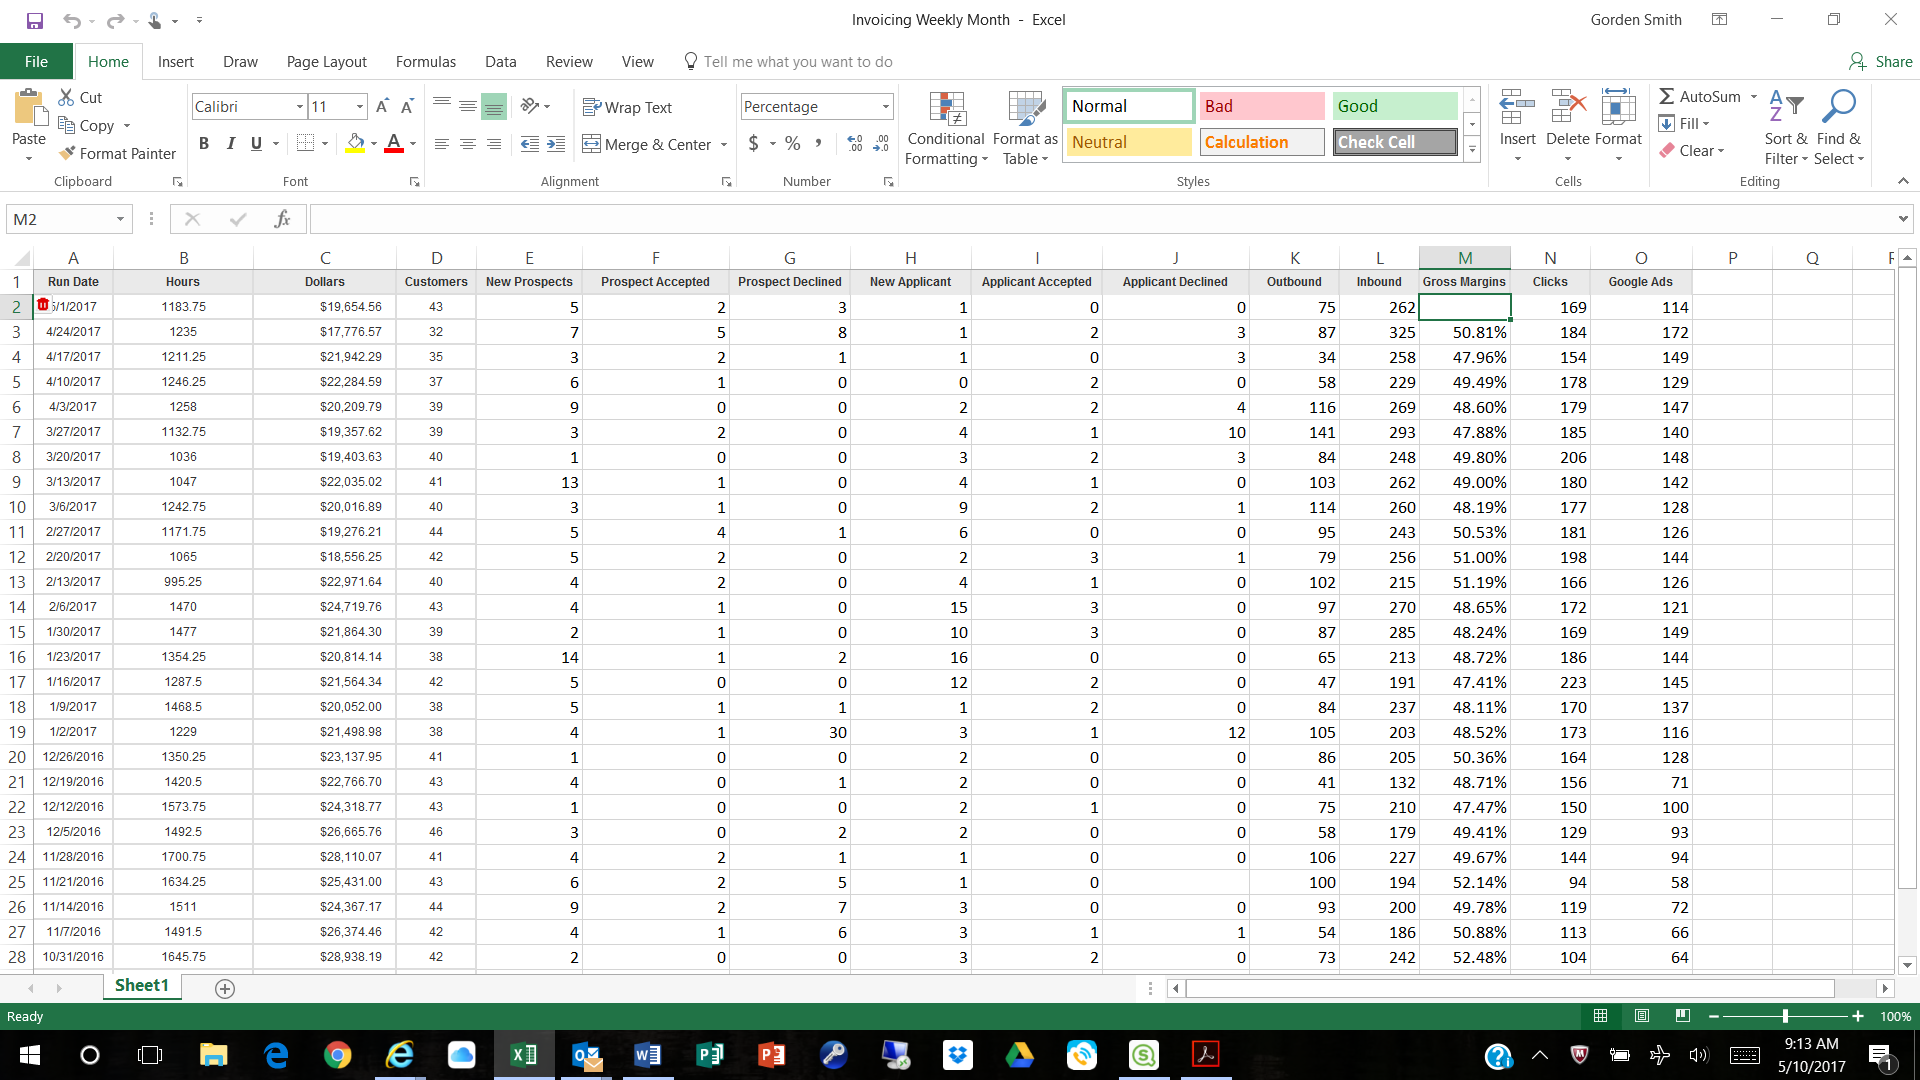
Hello, I'd like to post 2 KPIs...one showing the weekly average of sales for the year and one showing last week's sales. The weekly average for the year is simple, but is there an expression that will return the value of a specific cell in the spreadsheet?
Thank you!!
Accepted Solutions
- Mark as New
- Bookmark
- Subscribe
- Mute
- Subscribe to RSS Feed
- Permalink
- Report Inappropriate Content
- Mark as New
- Bookmark
- Subscribe
- Mute
- Subscribe to RSS Feed
- Permalink
- Report Inappropriate Content
Can you give more details?
Regards,
Tomasz
- Mark as New
- Bookmark
- Subscribe
- Mute
- Subscribe to RSS Feed
- Permalink
- Report Inappropriate Content
Hi Gorden,
May be like this
Sum({<Date={'10.05.2017'}>}Sale),
where Sale - field with value sale,
Date - field with date of analisys last week (this is provided that you use the Master calendar).
Regards,
Andrey
- Mark as New
- Bookmark
- Subscribe
- Mute
- Subscribe to RSS Feed
- Permalink
- Report Inappropriate Content
Hello Tomasz, I'm using an excel spreadsheet for my data and I'd like to show the sales from last week which is located at cell C2. I wish there was some way that I can show a KPI that will just show that cell value as a KPI from that cell. I update the spreadsheet once a week so the most current data will always be on the top line.
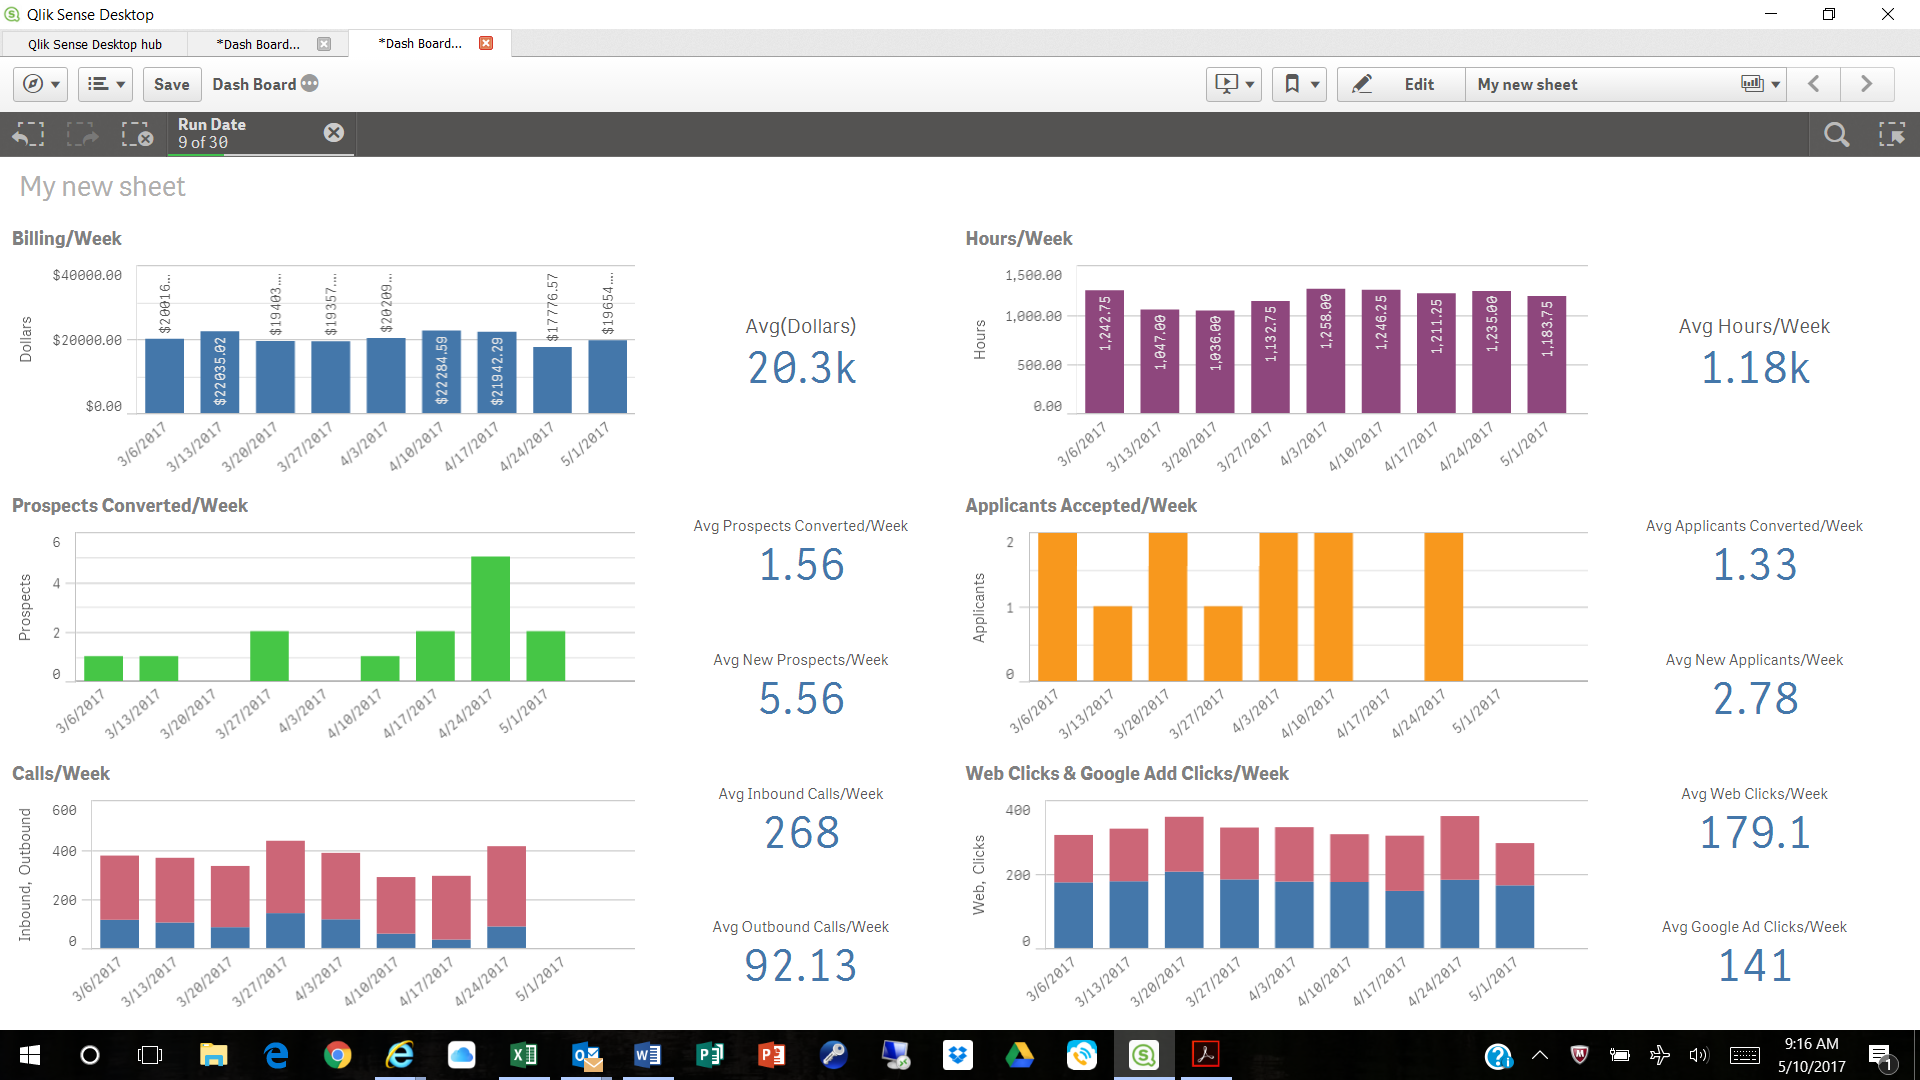
I want to show a KPI for last week and a KPI that is an average per week for the year. I know the bar graph shows last week's value, but its just to small as a visual when I'm presenting the info at our weekly meeting.
Appreciate your help!!! Thank you
- Mark as New
- Bookmark
- Subscribe
- Mute
- Subscribe to RSS Feed
- Permalink
- Report Inappropriate Content
I thin you can
A.
load only first row of a table:
FIRST 1 LOAD
Dollars AS KPIvalue
FROM [lib://FILE.xlsx]
(ooxml, embedded labels, table is sheet1);
B.
or use SET ANALYSIS to select value corresponding to the maximum date in the whole table
- Mark as New
- Bookmark
- Subscribe
- Mute
- Subscribe to RSS Feed
- Permalink
- Report Inappropriate Content
Tomasz, so I would just load the entire expression as it is written in the expression field?
FIRST 1 LOAD
Dollars AS KPIvalue
FROM [lib://FILE.xlsx]
(ooxml, embedded labels, table is sheet1);
Sorry I'm a newbie to Qlik Sense. I love it, but it's difficult to understand.
- Mark as New
- Bookmark
- Subscribe
- Mute
- Subscribe to RSS Feed
- Permalink
- Report Inappropriate Content
You can add a week field in your script:
week(Date) as week;
and then in the expression,
sum({<week={"$(=max(week))"}>}KPI)
please refer to this :
Or you can add your data through the data load editor (the wizard) and PREPARE your data before reloading!
Don't forget to PREPARE DATA to tell Qlik to PREPARE some things for you (AUTO CALENDAR, GeoData..)
Qlik Sense will create an auto calendar for you that you can use to build such expressions:
exp:
right click on your desired measure :
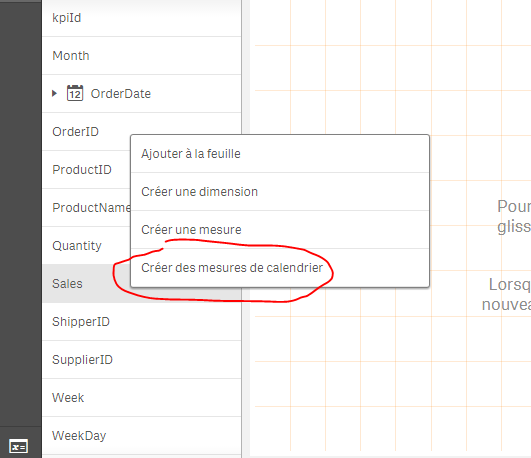
choose what type of measures you want to have :
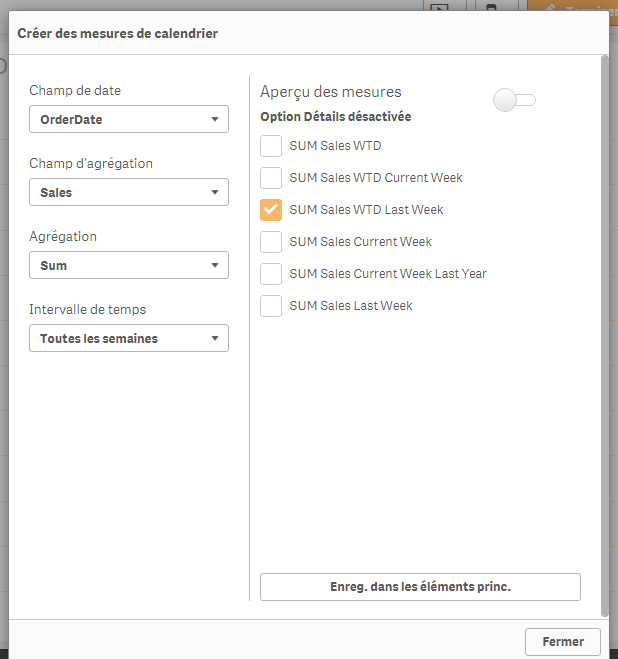
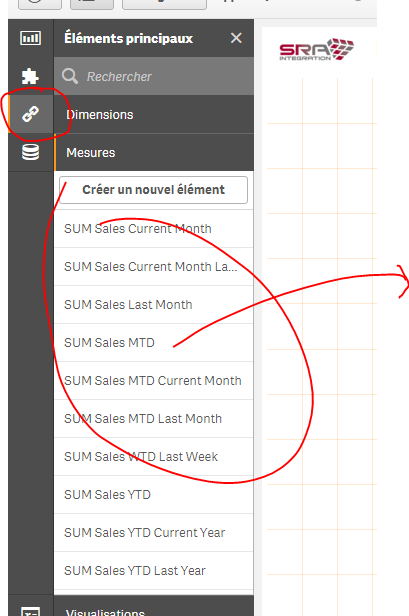
You'll find it as a master measure, just drag it, and you'll have your Last Week KPI:
- Mark as New
- Bookmark
- Subscribe
- Mute
- Subscribe to RSS Feed
- Permalink
- Report Inappropriate Content
As I understand, you need to show in your KPI the Dollars in the latest week. The cells in excel don't matter, and the data is already in your application. All you need to do as to write a proper expression in KPI.
Assuming that the "Run Date" identifies weeks, it could be something like this, if I got the field names right:
sum({<[Run Date]={"$(=date(max({1} [Run Date])))"}>} Dollars)
- Mark as New
- Bookmark
- Subscribe
- Mute
- Subscribe to RSS Feed
- Permalink
- Report Inappropriate Content
No, Gorden- it's for load script. Just load the table with only one row of one field. Then you can use it in the app with any aggregation.
- Mark as New
- Bookmark
- Subscribe
- Mute
- Subscribe to RSS Feed
- Permalink
- Report Inappropriate Content
Awesome!! That worked perfectly!!!
Thank you so much Michael for the help!!!!!