Unlock a world of possibilities! Login now and discover the exclusive benefits awaiting you.
- Qlik Community
- :
- Forums
- :
- Analytics
- :
- New to Qlik Analytics
- :
- Layout/background on the dashboard
- Subscribe to RSS Feed
- Mark Topic as New
- Mark Topic as Read
- Float this Topic for Current User
- Bookmark
- Subscribe
- Mute
- Printer Friendly Page
- Mark as New
- Bookmark
- Subscribe
- Mute
- Subscribe to RSS Feed
- Permalink
- Report Inappropriate Content
Layout/background on the dashboard
Hello everyone,
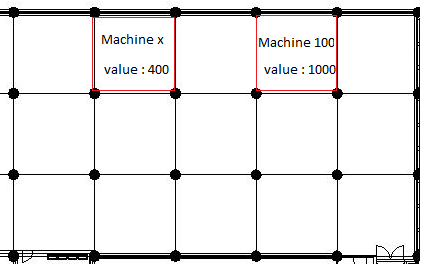
Recently, I came up with an idea, that I like add to my vizualization a layout/background, which it would describe a hall of production (exactly machines in the hall) in my organization. On this layout I would add amount of production that is currently in the workstation. Of course pieces is taken from the erp database.
Such vizualization would be better and more readable than table or pivot table. Production manager could see the whole technology process (machine by machine) , where and what is the value and on which machine. Something via MapQlik or geAonalytics.
In the attachment I am sending picture.
My question : Is it possible to achieve such a thing? If yes, so how??
Thanks in advance for advice.
Pat.
- Mark as New
- Bookmark
- Subscribe
- Mute
- Subscribe to RSS Feed
- Permalink
- Report Inappropriate Content
Do you have data set with you? For me looks like Pivot table with 2 expressions in each cell..
- Mark as New
- Bookmark
- Subscribe
- Mute
- Subscribe to RSS Feed
- Permalink
- Report Inappropriate Content
Hi,
You can try with Treemap Chart object in qliksense
Thanks
Deva